
From the Ag Optimus desk. This is the opinion of Ag Optimus.
The WASDE report contains a lot of numbers, but most corn, soybean, and wheat producers do not need to read every page. The useful question is simple: is the balance sheet for my crop getting tighter or looser — and does that change anything in my marketing plan?
WASDE stands for World Agricultural Supply and Demand Estimates. The USDA publishes it monthly with forecasts for U.S. and global production, use, trade, and stocks across the major crops. This guide covers how to read the WASDE report the way a producer should: what to check first, the five key numbers that tell the story, and simple rules that keep you from reacting to a headline without context. It is the companion piece to our guide on grain market reports, where WASDE sits at the top of the weekly routine.
Key Takeaways
-
- Read changes, not levels. Compare month-to-month and year-to-year changes, and weigh USDA against trade expectations, because markets usually react to the gap between the estimate and what was already priced in.
-
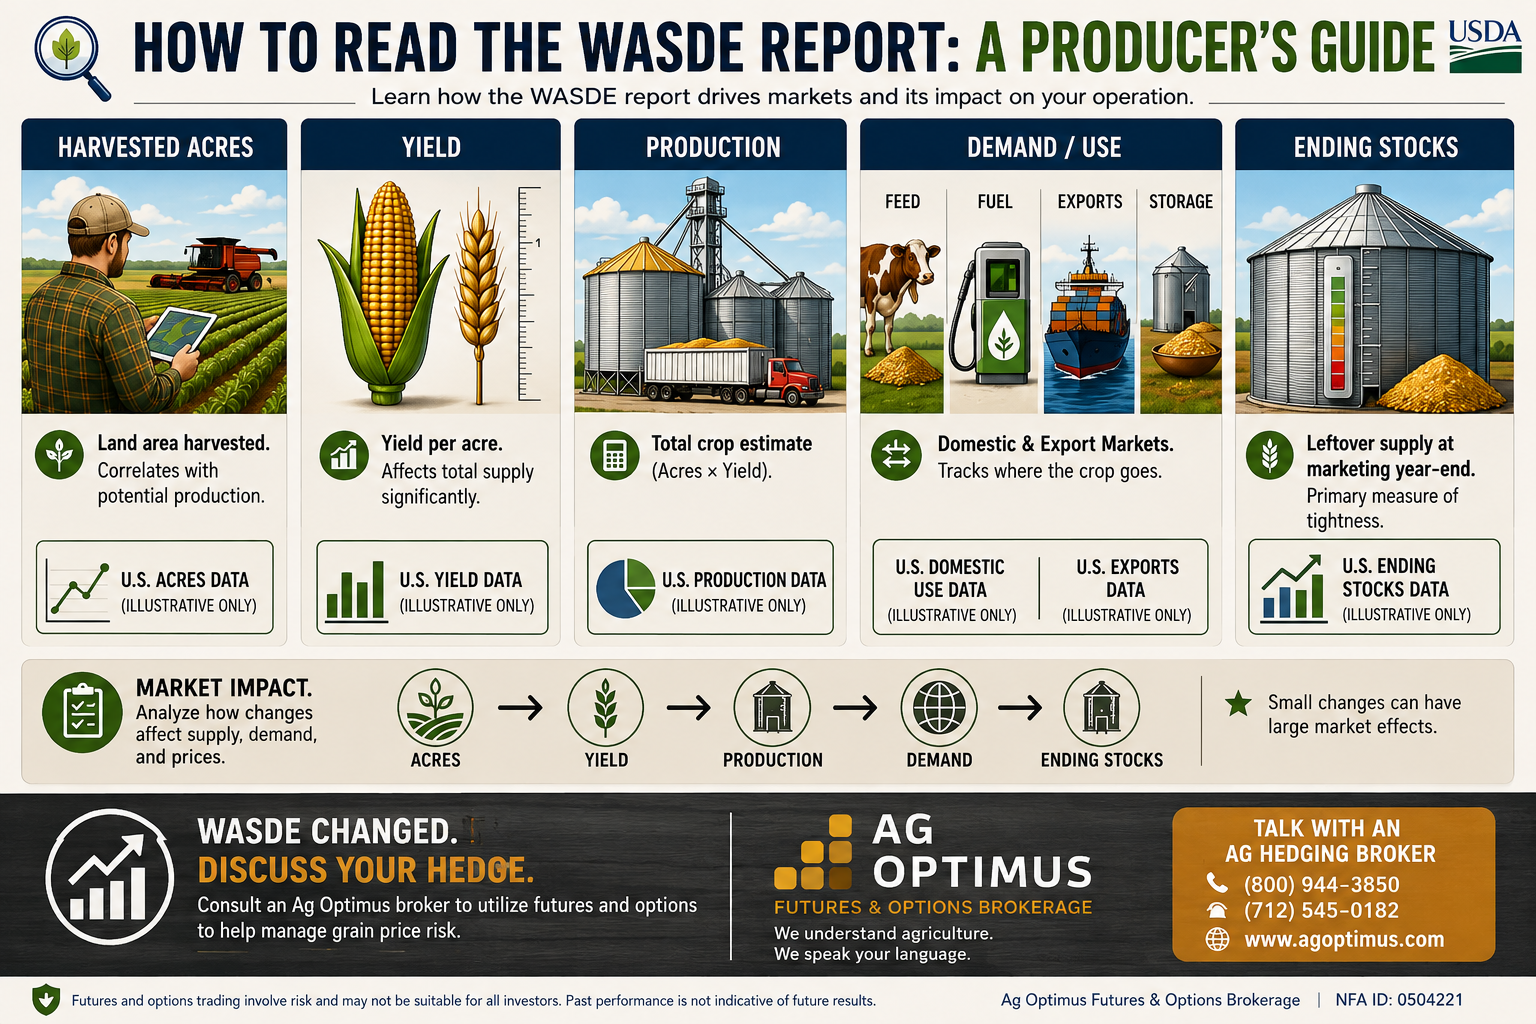
- Five numbers carry the WASDE report: harvested acres, yield, production, demand, and ending stocks — and the stocks-to-use ratio turns carryout into a percentage you can compare across years.
-
- It is information, not an instruction. The report tells you whether conditions for your crop are improving or weakening; the choice remains with your written marketing plan.
Start With What Changed
When a new WASDE report lands, do not begin by asking whether a number is bullish or bearish. Start with three comparisons: this month versus last month — what USDA revised; this year versus last year — whether supply is growing more abundant or more limited; and USDA versus market expectations — whether the estimate surprised the trade.
That third comparison explains most confusing report days. An estimate of 2.0 billion bushels for corn ending stocks may sound burdensome — but if the trade expected 2.1 billion, futures can rally, because the number was not as bearish as what was already priced in. The reverse holds too: a genuinely tight stocks figure can sell off when the market expected tighter still.
The Five Numbers That Carry the Report
| Measure | What it means | Why it matters to producers |
|---|---|---|
| Harvested acres | The acres USDA expects will actually be harvested. | More harvested acres can mean more production; fewer can limit supply even in a good-yield year. |
| Yield | Expected bushels per harvested acre. | A small national revision applies across millions of acres — the number weather markets trade on. |
| Production | Acres times yield: total new crop entering the balance sheet. | The major new supply. Ask whether it can meet demand and still build carryout. |
| Demand | Expected domestic use plus exports. | A balance sheet can tighten from stronger use just as easily as from a smaller crop. |
| Ending stocks | Expected bushels left when the marketing year closes. | The fastest read on whether USDA sees supplies tightening or building. |
Harvested acres rarely make headlines, but they determine production potential. When acreage estimates change, ask whether USDA changed planted or harvested acres, whether the change is big enough to matter, and whether it fits what you see locally.
Yield — bushels per acre — is what weather markets focus on. A one- or two-bushel revision per acre, across millions of harvested acres, quickly shifts total production. Never read yield alone — pair it with acres and production.
Production is acres times yield — the new supply entering the balance sheet. The question: is the crop big enough to meet estimated demand and still build carryout?
Demand receives less attention than production and moves balance sheets just as much. For corn, watch ethanol, feed and residual, and exports; for soybeans, crush and exports; for wheat, exports, food use, and feed use. A big crop with stronger use can carry out tighter than a small crop with fading demand.
Ending stocks — the carryout — are the fastest read on the whole table: falling stocks suggest a tightening balance sheet, rising stocks a more comfortable one, and unchanged stocks mean the moving parts offset. But carryout is not a price forecast. A market can rally on historically large stocks when participants expected them to be larger, and break on tight stocks when they expected tighter.
Stocks-to-Use: The Number You Compute Yourself
The WASDE report prints carryout in bushels; the trade reads it as a percentage. Divide ending stocks by total use, and you get the stocks-to-use ratio — the supply buffer left at year-end, expressed as a share of a full year’s demand. It is the closest thing the report offers to a true tightness gauge, and the most reliable way to compare today’s market with past years.
It beats raw carryout because demand grows over decades — a stocks number that sounded burdensome twenty years ago can be a much thinner cushion today. The ratio adjusts for scale across years. As a rough historical guide in corn, single-digit stocks-to-use has meant a genuinely tight market where rationing arguments take hold, while mid-teens and above has meant comfort — but treat those as context from history, not lines the market must obey.
How the Balance Sheet Works
Put it to work with one change. Say USDA lowers the national corn yield: production falls, and if ethanol, feed, and exports hold, fewer bushels remain at year-end — ending stocks decline, and the balance sheet tightens. Before that becomes a marketing decision, a producer still asks: did the market already expect the lower yield, did futures rally ahead of the report, is local basis improving or weakening, is there a workable margin against my break-even, and how many old- and new-crop bushels remain unpriced?
Now try a sneakier variation — one that catches producers off guard every summer. Suppose old-crop exports unexpectedly dry up in the final months of the marketing year. Old-crop ending stocks rise — and those same bushels become the new crop’s beginning stocks. The new-crop balance sheet loosens, and carryout grows even though yield and acres did not change at all. If a new-crop figure shifts and the reason is not in the new-crop table, check last year’s demand in the adjacent column — that is usually where the revision happened.
Where Each Crop’s Story Lives
Corn: start with the U.S. table — acres, yield, production, feed and residual, ethanol, exports, carryout — then check South America. Brazil and Argentina shape export competition, and the key concern is whether carryout is changing the risk around your remaining bushels.
Soybeans: the U.S. numbers matter, but beans are the most globally driven of the three. Watch crush and export demand alongside Brazilian and Argentine production — the question is whether a production change is being offset by stronger use, or supplies are building faster than demand.
Wheat: world trade runs this market. Read U.S. production, food and feed use, and exports — then the major exporters. Ask whether world exportable supply is growing or shrinking, and how that affects the outlook for U.S. exports.
That is the general shape of the U.S.-versus-world split: use the U.S. balance sheet to judge the domestic cash and futures environment, and the world tables to judge competition and import demand — a large crop somewhere else raises competition for your bushels, while a production problem abroad lifts demand for them.
The 10-Minute WASDE Routine
| 1 | Go straight to the U.S. balance sheet for your crop. |
| 2 | Examine how production, demand, and ending stocks changed from last month. |
| 3 | Determine which one or two adjustments drove the carryout change. |
| 4 | Review the world section covering South America for corn and soybeans, and the major exporters for wheat. |
| 5 | Note whether the report exceeded, fell short of, or met expectations. |
| 6 | Review futures, local cash bids, basis, and carry. |
| 7 | Compare the opportunity with your break-even and cash-flow needs, plus your storage position and unpriced bushels. |
| 8 | Decide whether the report changes your written marketing plan — and if so, convert the changes into working orders instead of intentions. |
When the WASDE Report Matters Most
Every monthly release can move the board, but the center of gravity shifts through the year. Winter and early spring are about old-crop demand and early new-crop expectations. May brings USDA’s first full projections for the new marketing year, providing the first complete look at next year’s balance sheet. Summer focuses on acreage and weather; fall on yield and production; winter finalizes the numbers and pivots toward the next planting cycle.
August is explosive for a specific reason: the yield changes authorship. From May through July, the yield in the WASDE report comes from the World Agricultural Outlook Board — a weather-and-trendline model, a mathematical projection of the crop. In August, the National Agricultural Statistics Service takes over with survey-based estimates built from farmer questionnaires and objective field measurements. USDA replaces the model with boots-in-the-field data, and when the measured crop disagrees with the modeled one, the market reprices fast. That is why August belongs on the calendar next to May.
The WASDE report also takes input from two outside sources. The NASS Quarterly Grain Stocks report in September counts the grain actually sitting in bins, and January brings final crop production. When those counts disagree with what the balance sheet implied, USDA often adjusts through feed and residual — the balance sheet’s reconciling line, sometimes called its “fudge factor,” where predicted and actual grain quantities get squared up. A sudden feed-and-residual revision is frequently a stocks-count story, not a livestock story — knowing that keeps a producer from misreading it as a demand collapse or boom.
The Report-Day Playbook
Different WASDE headlines set up different conversations. None of these are trade signals: the middle column illustrates how markets have usually moved, not how they must, and the last column gives you the conversation to start with your broker.
| The WASDE headline | What it typically means for the board | What to discuss with your Ag Optimus broker |
|---|---|---|
| Yield cut, or ending stocks tighter than expected | The board often rallies as the balance sheet tightens — how far depends on what was already priced in. | Which unpriced tiers the rally should cover, and whether futures, hedge-to-arrive, or a put price floor fits each one — plus margin cash-flow planning if a short hedge rides a rising market. |
| Stocks higher than expected, or a demand cut | As the cushion grows, the board often breaks, and rallies get sold until the demand story improves. | Whether your downside triggers are active working orders rather than intentions — and after re-running break-even, whether setting a floor beats waiting for a better board. |
| “Bullish” number — but the market falls | The trade expected tighter. Positioning built ahead of the release unwinds, and the reaction runs opposite the adjective. | Whether your plan trades the report or the reaction — and how pre-placed orders around release day keep one confusing session from rewriting a sound plan. |
| Old-crop demand revised — new-crop carryout jumps | Bushels that did not ship become new-crop beginning stocks; new-crop weakens with yield and acres unchanged. | Treating old-crop and new-crop bushels as separate decisions — which sales and coverage belong to each crop year, at each crop year’s price. |
| August: survey yields replace the model | Measured data meets modeled expectations — the year’s widest report-day ranges tend to live here. | Reviewing every working order before the release — a GTC order will follow its instructions through a limit move whether or not they still fit — and sizing so one violent session cannot force your hand. |
The Most Important Rule (IN OUR OPINION)
A WASDE report is information — not an instruction. It does not tell any producer to sell, store, hedge, or wait. Its value is helping you see whether the supply-and-demand environment for your crop is improving, weakening, or holding steady — Ask the same questions every month: what changed in supply and in demand, why carryout moved, whether USDA surprised expectations, whether there is a workable margin at your farm’s numbers, and whether any of it changes your written marketing plan.
Use the WASDE report to refine decisions over time. Don’t abandon a sound plan after a single release, and don’t treat waiting for a perfect one as a reason to have no plan at all.
Report day is a bad day to be alone with a marketing plan. Our brokers read WASDE the morning it drops and talk it through with grain producers the same day — what moved, what it means for your unpriced bushels, and whether anything in the plan should change.
Call us toll-free at (800) 944-3850 or locally at (712) 545-0182 to speak with an Ag Optimus broker.
Frequently Asked Questions
Which WASDE numbers matter most to a grain producer?
Five numbers matter most: harvested acres, yield, production, demand, and ending stocks. Identify which of those moved carryout this month, and you understand the report — everything else is supporting detail.
What are ending stocks, and why does everyone watch them?
Ending stocks — carryout — are the bushels expected to remain when the marketing year closes: beginning stocks plus production and imports, less domestic use and exports. They are the single quickest read on whether USDA sees the balance sheet tightening or building, though they are not a price forecast on their own.
Why did the market fall on a bullish WASDE report?
Because markets trade expectations, not adjectives. If traders positioned for an even tighter number than USDA printed, a bullish report can still disappoint, and prices fall as that positioning unwinds. Compare the estimate with pre-report expectations before judging the reaction.
Which WASDE reports are the biggest of the year?
May and August. May contains USDA’s first complete projections for the new marketing year, while August brings the first survey-based yield estimates. Both regularly reset the market’s supply assumptions, and both belong on a producer’s calendar in advance.
Do I need to read the whole WASDE report?
No. Ten minutes covers it: your crop’s U.S. balance sheet, the change from last month, the relevant world section, and the market’s reaction versus expectations. The routine in this guide turns the release into a quick checklist rather than an afternoon.
What is a good stocks-to-use ratio?
There is no single cutoff, but history gives context: single-digit stocks-to-use ratios have typically indicated tight supplies in corn, while mid-teens and above suggest ample stocks. The ratio’s real value is in comparison — putting this year’s buffer beside past tight and loose years to see how much historical support current prices have.
What is feed and residual in the WASDE report?
Feed and residual is the demand category for grain fed to livestock plus uses the ledger cannot directly measure — the balance sheet’s reconciling line. When Quarterly Grain Stocks counts find more or less physical grain in bins than the models implied, the adjustment often shows up here. Large feed-and-residual revisions are usually about the stocks count, not an actual swing in livestock feeding.
This material is general educational content from Ag Optimus. Ag Optimus is an introducing broker registered with the NFA and CFTC (NFA ID 0481133). References to USDA and other third-party reports are for informational purposes only; Published estimates may be revised after release. Figures in examples are hypothetical and for illustration. No report removes price risk or guarantees a marketing outcome. Trading futures and options involves substantial risk of loss and is not suitable for all investors; you may lose more than your initial deposit. Past performance is not necessarily indicative of future results. Every operation is different; evaluate any decision against your own production costs, marketing plan, financial situation, and risk tolerance, and consult your broker regarding suitability.
