

The grain companies, processors, and end users with real physical exposure to corn, beans, and wheat. When they’re heavily short, it often signals they expect prices to fall. When they’re covering, it can signal the opposite.
AI SOLUTIONS
The Market Is Telling You Something. Numbers.ag Helps You Hear It.
Every week the CFTC publishes data on exactly how large traders are positioned across corn, soybeans, wheat, and cattle. Most producers never look at it. Numbers.ag turns that data into plain-language insights — so you can make marketing decisions based on where the money is moving, not just where prices were yesterday.
Trader's Position for CORN
Leveraged Money · Feb 03 2026
Trader Group
Contracts
Change
Sentiment
Long
145,705
▲ +8,204
Short
389,428
▼ −3,112
Net Position
−243,723
▼ −11,316
52-Week Sentiment
● Bearish (Rank 32)
UNDERSTANDING THE DATA
Most Producers Have Never Heard of COT Data.
The Big Traders Rely on It Every Week.
The Commitments of Traders report is published weekly by the CFTC — the federal regulator that oversees futures markets. It shows exactly how three groups of traders are positioned: commercial hedgers, large speculators, and small traders. When you know how those groups are leaning, you have context that most farmers never think to look for.
01
Commercial Hedgers
02
Leveraged Money (Speculators)
Hedge funds and large managed money traders who move markets with position size. They have no physical crop — they’re betting on price direction. Knowing which way they’re leaning is valuable context for any marketing decision.
03
The WASDE Report
The USDA’s World Agricultural Supply and Demand Estimates — released monthly — is the single most market-moving report in ag. Numbers.ag turns dense WASDE tables into clear, readable summaries the moment they’re published.
What Numbers.ag Does
Turning Ag Complexity into Clarity.
COT reports are published as dense spreadsheets that take real expertise to interpret. WASDE reports run dozens of pages. Numbers.ag transforms both into clear, high-contrast visuals and plain-language analysis you can actually act on.
The AI interface lets you ask direct questions — "What is the current net speculator position in corn?" or "What does the latest WASDE signal for soybean prices?" — and get an answer in seconds, not after an hour of spreadsheet work. Disclaimer: AI analysis may have errors
Decision-support, not a crystal ball. Numbers.ag is a tool for better-informed decisions — not a trading signal or recommendation system. Your AgOptimus broker uses it alongside you as one input into your overall marketing plan.
01
Decode
Dense COT and WASDE reports are transformed into visuals that reveal market direction in seconds. No spreadsheet expertise required.
02
Filter
The AI pinpoints the specific shifts and positions affecting your commodity and your marketing window — cutting through the noise to what actually matters.
03
Anticipate
Cot data is public — the challenge is interpretation. We process each weekly release, reported as of the prior Tuesday, and translate positioning shifts into plain-language context for ag markets
04
Execute
Move with data-backed logic to protect your operation. Your AgOptimus broker is there to help translate the analysis into an actual hedge decision.
See What the Big Traders Are Doing.
Talk to an AgOptimus broker about accessing Numbers.ag alongside your brokerage account.
The AI Interface
Ask Anything About the Market. Get an Answer in Seconds.
Instead of digging through a 40-page USDA report or interpreting a COT spreadsheet, you ask a question in plain English. Click any example below to see how Numbers.ag decodes the data.
Try a question:
Numbers.ag AI Analyst
COT Report · Feb 03 2026
Leveraged money — the large speculative funds — is currently net short corn by 243,723 contracts, with 145,705 long and 389,428 short positions. That's a bearish reading at the 32nd percentile of the 52-week range, meaning speculators are more short than they've been about 68% of the past year.
What this tells you: large funds are not positioned for a near-term rally. However, heavily short speculative positioning can also be a contrarian signal — when funds eventually cover those shorts, it creates buying pressure that can lift prices. The key question is what would trigger that covering: a bullish USDA surprise, weather disruption, or export demand shift.
This is one data point in your marketing decision — not a sell signal by itself.
For illustrative purposes only. Decision-support tool — not a trading recommendation. Verify against raw data visuals before acting. Past performance is not indicative of future results.
Free access available. Numbers.ag offers a free tier with 2 prompts per day and regular market updates. Full access is available with an AgOptimus brokerage account.
LATEST ARTICLES
Check out the latest industry articles
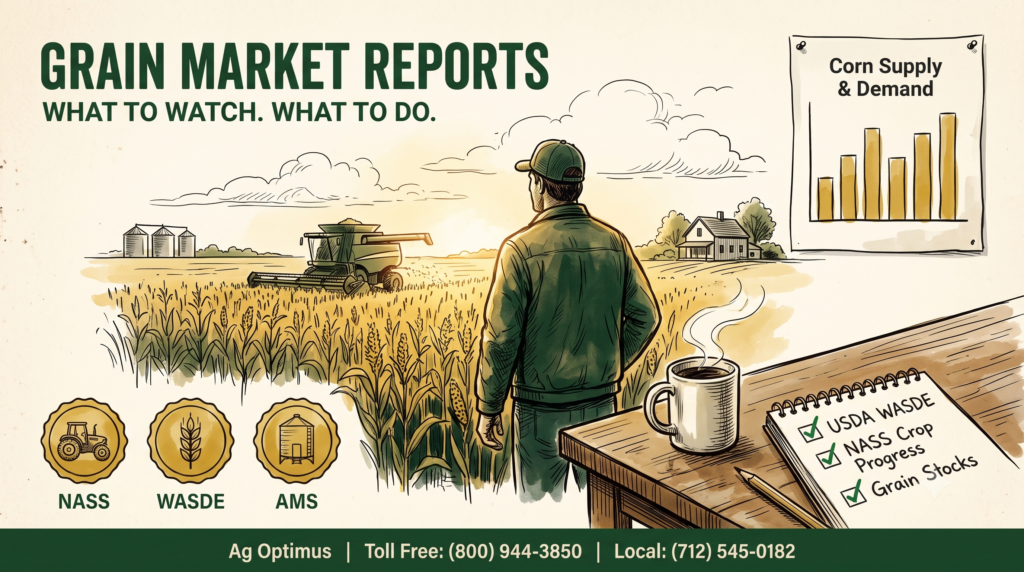
Grain Market Reports That Improve Margins
Grain Market Reports That Improve Margins

Grain & Livestock COT Report — July 27, 2026 · COT positioning as of Tuesday, July 21, 2026
Grain & Livestock COT Report — July 27, 2026 · COT positioning as of Tuesday, July 21, 2026

Cattle Feeder Market Reports That Improve Margins
Cattle Feeder Market Reports That Improve Margins
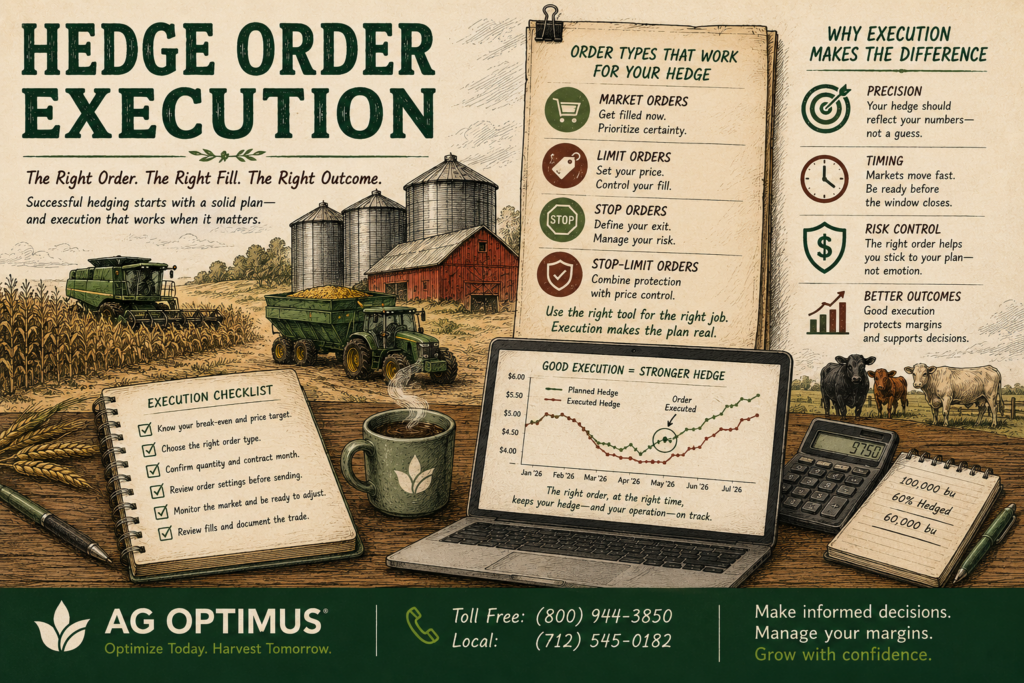
Hedge Order Execution: Getting a Fill That Fits
Hedge Order Execution: Getting a Fill That Fits
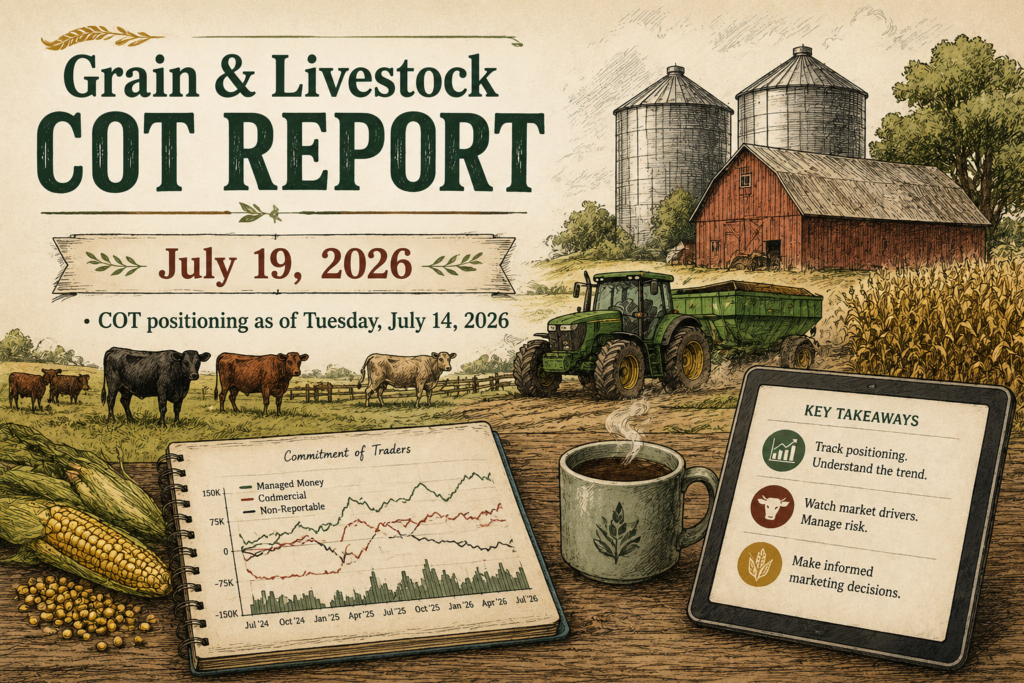
Grain & Livestock COT Report — July 19, 2026 · COT positioning as of Tuesday, July 14, 2026
Grain & Livestock COT Report — July 19, 2026 · COT positioning as of Tuesday, July 14, 2026
FAQs
COT data is new territory for most producers. These are the questions we hear most often when we introduce it.
What is COT data and why does it matter?
The Commitments of Traders report is published weekly by the CFTC and shows how different groups of traders — large speculators, commercial hedgers, and small traders — are positioned across futures markets. It matters because position changes by large traders often precede price moves. Knowing how they’re leaning gives you context most producers don’t have.
What is basis and why does it matter?
Basis is the difference between your local cash price and the futures price. It reflects transportation costs, local supply and demand, and storage availability. Understanding basis helps you decide not just when to sell, but where and how. Our Grain Basis tool tracks basis levels at elevators near you so you can make more informed decisions.
Do I need a large operation to work with a broker?
Not at all. We work with operations of all sizes. With the introduction of mini and micro futures contracts, even smaller producers can access meaningful price protection. The right question isn’t how big your farm is — it’s whether price risk affects your bottom line. If it does, we can help.
What's the difference between a hedge and a speculative trade?
A hedge is tied to a real position — you’re selling futures against grain you’re actually growing. It’s designed to reduce risk, not create it. Speculation means taking a market position without an underlying commodity. We focus exclusively on hedging strategies that protect your production revenue.
Content and analysis generated by Numbers.ag incorporates artificial intelligence tools. AI-generated analysis is not trading advice nor is it a substitute for professional financial advice and may contain errors or omissions. Outputs do not constitute trading recommendations.