
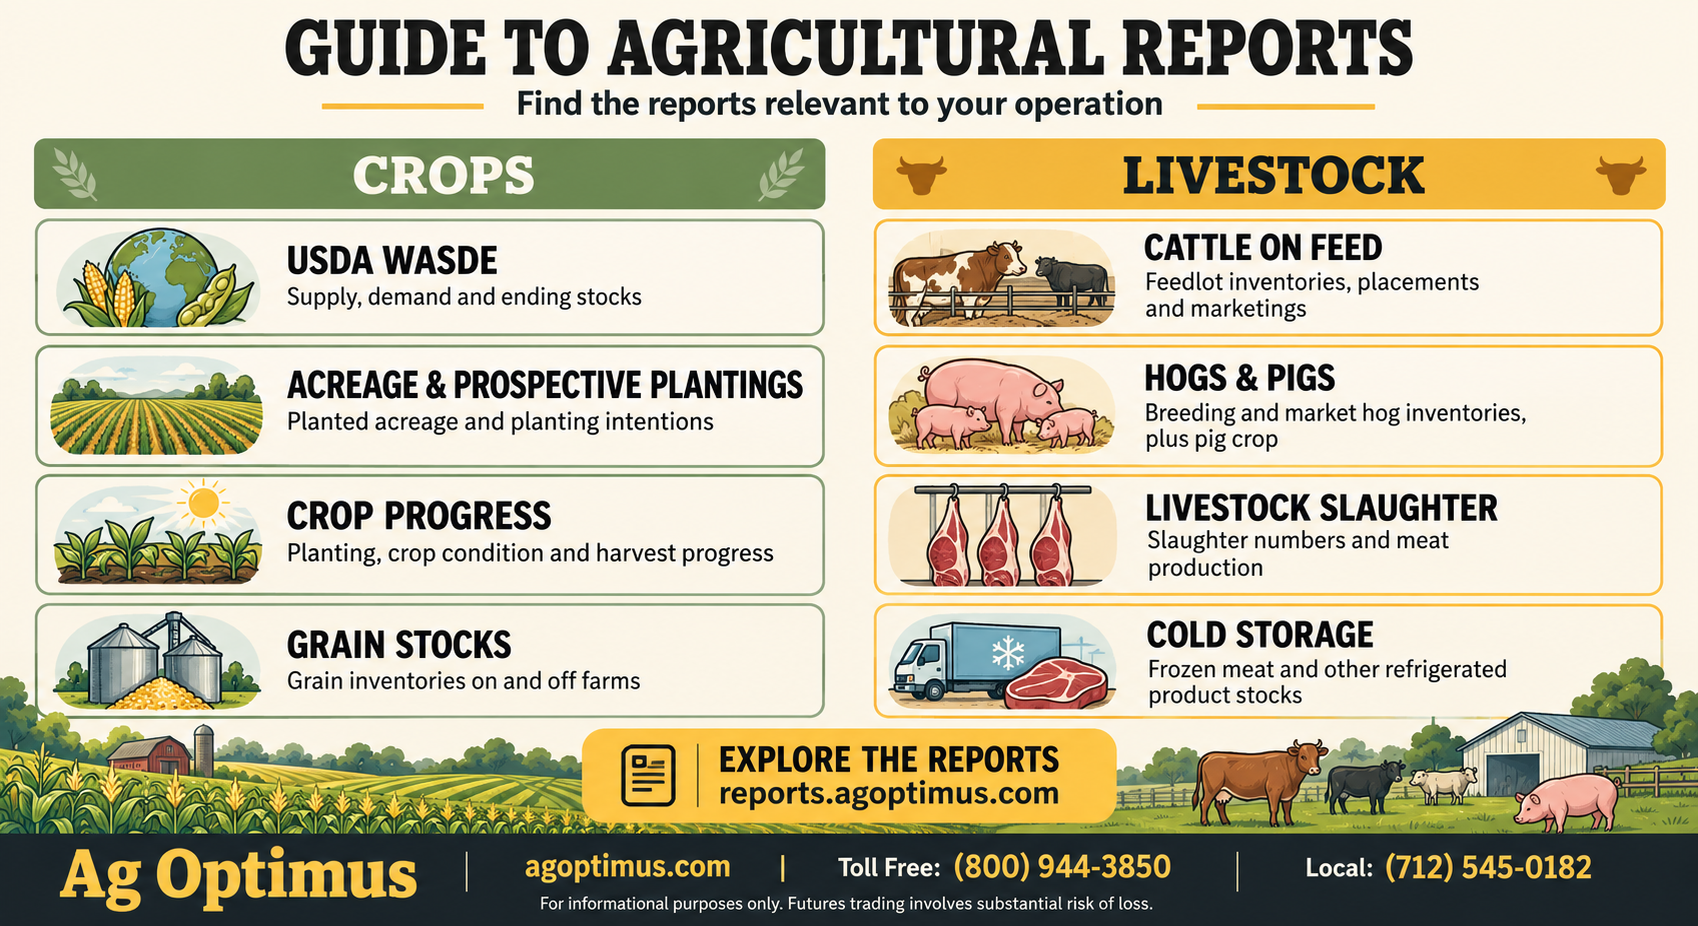
For crop size, start with USDA Crop Production. For supply, use, and ending stocks, read WASDE. For growing-season conditions, use Crop Progress. Cattle on Feed covers large-feedlot inventories and cattle movements; Hogs and Pigs covers hog inventories and reproduction. CFTC Commitments of Traders reports show delayed futures-market positioning.
The report you need depends on the question. A corn grower checking harvest progress needs different information from a cattle feeder reviewing feedlot placements or a soybean producer following export demand.
This guide explains the main reports and links directly to the corresponding pages on the Ag Optimus agricultural reports dashboard. Use the finder below to choose a report, then check the date, reporting period, and units on its page.
Government agencies publish the underlying estimates and reported figures. Ag Optimus presents selected data, comparisons, calculations, and commentary separately from those agencies. Dashboard updates may lag an official release; the original agency publication remains the reference for verification.
Find the report that answers your question
| Your question | Report or data series | Open the page (click on link) |
|---|---|---|
| Did USDA change crop yield or production? | NASS Crop Production | Crop Production estimates |
| How much grain may remain after this marketing year’s use? | USDA WASDE | WASDE supply and demand tables |
| How are planting, crop condition, and harvest progressing? | NASS Crop Progress | Crop Progress and condition data |
| How much acreage is estimated for corn, soybeans, or wheat? | NASS acreage estimates | Crop acreage data |
| How much grain is held on farms and in commercial storage? | NASS Grain Stocks | Grain Stocks inventories |
| How many cattle are on feed, being placed, or marketed? | NASS Cattle on Feed | Cattle on Feed data |
| How large are the breeding and market-hog inventories? | NASS Hogs and Pigs | Hogs and Pigs inventories |
| What are foreign buyers purchasing, and what has been shipped? | USDA FAS Export Sales | Weekly Export Sales data |
| How much grain has been inspected or weighed for export? | USDA AMS/FGIS export inspections | Grain Export Inspections |
| What cash bids and basis are reported for available locations? | USDA AMS cash-market reports | Cash grain bids and basis |
| How are reportable traders positioned in agricultural futures? | CFTC Commitments of Traders | Agricultural COT positioning |
CropsSupply & demandLivestockExports & cashPositioning
Prospective Plantings is a separate annual report about planting intentions. Its distinction from June Acreage is explained below, with a link to the official publication.
USDA crop production and grain supply reports
Crop Production measures acreage, yield, and crop size
USDA’s National Agricultural Statistics Service, or NASS, publishes Crop Production monthly. The commodities and estimates covered vary by issue; a monthly release does not mean every crop receives a new yield estimate that month.
For a grain crop, production depends on harvested acreage and yield per harvested acre. A yield change alone does not describe the whole production revision if acreage also changes.
On the Ag Optimus Crop Production page, review the crop, measurement, year, and comparison shown. Distinguish a yield figure in bushels per acre from production in bushels. Compare wheat classes like for like.
Crop Production addresses crop size. To see how that crop fits with imports, use, and remaining supplies, continue to WASDE.
WASDE connects production with demand and ending stocks
The World Agricultural Supply and Demand Estimates report, known as WASDE, is prepared and released monthly by USDA’s World Agricultural Outlook Board. It includes U.S. and world agricultural supply-and-use estimates and forecasts.
For a U.S. grain balance sheet, ending stocks are beginning stocks plus production and imports, less total use. Total use includes domestic use and exports. All figures must refer to the same commodity, marketing year, and units.
The WASDE supply and demand page brings together selected balance-sheet figures and comparisons. Review beginning stocks, production, domestic use, exports, and ending stocks before drawing a conclusion from a yield headline.
A smaller crop does not necessarily mean lower ending stocks. Use may fall too. Stocks-to-use adds context by expressing ending stocks as a percentage of total use; it is a calculated ratio, not a price forecast.
Prospective Plantings and Acreage answer different questions
Prospective Plantings reports intentions. Acreage provides June acreage estimates, which remain subject to revision. Both are NASS publications. Prospective Plantings is generally released in March, while Acreage is generally released in June.
For intentions, consult the official USDA Prospective Plantings report. For the acreage figures available in the dashboard, open Ag Optimus crop acreage data.
Check whether a figure represents planted acres, intended acres, or area expected to be harvested. Those measures answer different questions. A June estimate is not a final count of the acres eventually harvested.
Grain Stocks measures inventory at a stated date
NASS Grain Stocks estimates supplies held on farms and in off-farm facilities. The major-grain inventory reference dates are March 1, June 1, September 1, and December 1. The reports are published later; December inventories are normally released in January.
Use the Grain Stocks inventory page to compare the same commodity and reference date across years and to distinguish on-farm from off-farm supplies.
Stocks changes contribute to estimates of disappearance, but an inventory report does not independently identify every bushel used for feed, processing, or exports. Nor is an inventory snapshot interchangeable with WASDE’s forecast of stocks at the end of a marketing year.
Crop Progress tracks development and condition
NASS Crop Progress reports planting, development, harvesting, and condition for selected crops and states. The national report is generally released on the first business day of the week, April through November, with estimates referring to Sunday.
The Crop Progress and condition page lets you check the crop measures currently displayed. Planting and harvest percentages describe how far work has progressed. Condition percentages describe the share rated very poor, poor, fair, good, or excellent.
A good/excellent percentage is not a yield estimate. Compare the same crop and stage over time, and remember that a national figure does not describe every field or production region.
Export reports and cash grain markets
Export Sales covers commitments and reported exports
USDA’s Foreign Agricultural Service, or FAS, publishes weekly Export Sales information. It includes sales activity, outstanding sales, and reported exports. A commitment to buy grain is different from a completed shipment.
On the weekly Export Sales page, check net sales, reported shipments, and the marketing year. Separate current-year business from sales for a later marketing year. Net sales can reflect reductions and adjustments as well as new business.
One week of sales does not establish the final export outcome. Looking at several weeks and the remaining commitments helps put an unusually large or small reading in context.
Export Inspections tracks inspected or weighed grain
USDA’s Agricultural Marketing Service and Federal Grain Inspection Service publish grain inspection information. The weekly series reports grain inspected and/or weighed for export under the relevant inspection system.
The Grain Export Inspections page provides a separate view of export activity. Inspections and FAS export figures have different coverage and timing, so you should not substitute one for the other without checking definitions. A cumulative total also needs a clearly defined period before it can be compared with a marketing-year forecast.
Cash bids and basis connect national reports with a local market
Basis is the cash price minus the relevant futures price. The comparison needs a specified futures month, delivery period, commodity, and location. Freight, storage, quality, and local supply and demand can affect the relationship.
Review open cash grain bids and basis to see the locations and quotes available. A reported bid is a dated observation, not a guarantee that a buyer will accept your grain at that price or on your delivery terms. Confirm an actionable bid with the buyer.
A futures move following a national report does not establish the change in your net cash price. Basis and delivery costs still matter.
USDA livestock reports for cattle and hog producers
Cattle on Feed covers large-feedlot inventory and flows
NASS Cattle on Feed is a monthly report for feedlots with capacity of at least 1,000 head. Its inventory is measured on the first of the month; placements and marketings cover the preceding month.
| Measure | What it represents |
|---|---|
| On feed | Cattle and calves being fed for the slaughter market at the inventory date |
| Placements | Steers and heifers entering feedlots for feeding toward the slaughter market |
| Marketings | Fed steers and heifers shipped from feedlots to slaughter markets |
| Other disappearance | Deaths, movement to pasture, and transfers to other feedlots for further feeding |
| Placement weight groups | Numbers placed within specified weight categories, not a measured finishing date |
The Cattle on Feed report page presents inventory, placement, and marketing figures. This is not a count of the entire cattle herd or a quote for a particular group of calves.
Hogs and Pigs separates inventory from reproduction
NASS publishes Quarterly Hogs and Pigs in March, June, September, and December. It reports breeding and market inventories, market-hog weight groups, farrowings, pigs per litter, pig crop, and farrowing intentions.
Use the Hogs and Pigs report page to review the displayed inventory period. Completed farrowings describe sows that have given birth during a reported period. Farrowing intentions describe expected future activity; they are not completed production.
For a feeder or producer buying grain, livestock inventory information and feed-cost information answer separate parts of the business question. The crop-production and WASDE sections above provide the grain-supply context, while actual feed purchases depend on local prices and contract terms.
CFTC Commitments of Traders reports for agricultural markets
The Commitments of Traders, or COT, reports describe market positioning. They are not USDA crop or livestock reports. CFTC normally releases them on Friday at 3:30 p.m. Eastern Time, using positions from the preceding Tuesday; holidays and other interruptions can change that schedule.
The agricultural COT report page presents positioning for selected agricultural futures markets. Check the position date, market, trader category, and report variant before comparing figures. Futures Only and Futures and Options Combined are different series.
In Disaggregated COT reports, Managed Money includes registered commodity trading advisers, commodity pool operators, and identified unregistered funds. Producer/Merchant/Processor/User covers businesses predominantly involved in physical commodities. These classifications do not prove the motive behind every position.
Net position is longs minus shorts within the specified series and category. A historical rank is a further calculation: it needs a stated lookback and ranking method. Neither a large net position nor an extreme rank establishes that prices must rise, fall, or reverse.
Agricultural report release calendar
Use this table for the normal pattern, then confirm the next date on the agency’s schedule. Times are Eastern Time; holidays and announced changes can alter releases.
| Report | Normal release pattern | Agency |
|---|---|---|
| Crop Production | Monthly, noon | USDA NASS |
| WASDE | Monthly, noon | USDA WAOB |
| Prospective Plantings | Annually in March | USDA NASS |
| Acreage | Annually in June | USDA NASS |
| Grain Stocks | Four times yearly, generally January, March, June, September | USDA NASS |
| Crop Progress | Weekly April–November, first business day, 4 p.m. | USDA NASS |
| Cattle on Feed | Monthly, 3 p.m. | USDA NASS |
| Hogs and Pigs | March, June, September, December, 3 p.m. | USDA NASS |
| Export Sales | Weekly, normally Thursday, 8:30 a.m. | USDA FAS |
| Export Inspections | Weekly | USDA AMS/FGIS |
| Commitments of Traders | Normally Friday, 3:30 p.m.; preceding Tuesday positions | CFTC |
Confirm NASS releases using the official USDA NASS report calendar. WASDE, FAS, and CFTC maintain their own release information in the official sources below. A report date, an inventory date, and a marketing year are different labels; check which one a table uses.
How to read the figures and comparisons
Start with the commodity, reporting period, geography, and units. Then distinguish three kinds of information:
For any comparison with “trade expectations,” look for the named survey, its date, and the measure being compared. For revisions, compare the same commodity and period across releases. For historical ranks, check the lookback and whether higher ranks mean higher or lower readings.
These checks help prevent a change in reporting period, units, or methodology from being mistaken for a change in the market itself.
Frequently asked questions
Which USDA reports should a corn or soybean producer follow?
Crop Production covers crop size, WASDE covers supply and use, Grain Stocks covers inventories, and Crop Progress covers seasonal development and condition. Prospective Plantings and Acreage address planting intentions and acreage estimates. Export Sales and Export Inspections provide additional demand and movement information.
Which reports are useful for wheat producers?
Crop Production, WASDE, Grain Stocks, Crop Progress, acreage reports, and export data address different parts of wheat supply and demand. Distinguish winter wheat, spring wheat, durum, and individual classes where reported. An all-wheat total can conceal differences between the classes relevant to your operation.
What is the difference between WASDE and Crop Production?
Crop Production provides crop acreage, yield, and production estimates, with coverage varying by issue. WASDE places production alongside other supply components, domestic use, exports, and ending stocks. The two reports answer related but different questions.
What does the Cattle on Feed report tell a cattle producer?
It describes inventory and cattle flows in feedlots with capacity of at least 1,000 head. It does not measure the entire cattle herd, set local calf prices, or calculate an operation’s cost of gain.
Are Crop Progress condition ratings a yield forecast?
No. Condition ratings describe a crop’s share across five condition categories. They do not provide a direct bushels-per-acre estimate or establish the yield a particular farm will harvest.
When does the CFTC release COT reports?
Normally Friday at 3:30 p.m. Eastern Time, reflecting the preceding Tuesday’s positions. Holiday schedules and other interruptions can change the release. The data is delayed, not live positioning.
Can these reports tell me when to sell grain or cattle?
No report establishes the right sale date for an individual operation. Local bids, basis, production, storage, delivery commitments, feed costs, and financing can differ from the national conditions in a report. Historical relationships and positioning extremes do not guarantee a future price outcome.
Use the report-finder links above to go straight to crop, livestock, export, cash-market, or positioning data. For an overview across the available report pages, visit the Ag Optimus Reports dashboard.
Check the displayed data date before using a comparison, and consult the official release to verify an estimate, definition, or revision.
Official sources
Sources checked September 25, 2026. Publication pages are updated as new reports become available.
- USDA NASS Crop Production — report scope, monthly frequency, and releases.
- USDA WAOB WASDE — responsibility, supply-and-use coverage, and release schedule.
- USDA NASS Prospective Plantings — annual planting-intentions report.
- USDA NASS Acreage — annual acreage report; estimates remain subject to revision.
- USDA NASS Grain Stocks — on-farm and off-farm inventories.
- USDA NASS Crop Progress and Condition survey guide — survey definitions, reference period, and seasonal schedule.
- USDA FAS Export Sales Reporting Program — sales and export reporting and release timing.
- USDA AMS/FGIS data and statistics — official export-inspection report access.
- CME Group explanation of grain basis — cash/futures relationship. CME is an exchange source, not a government agency.
- USDA NASS Cattle on Feed — report scope and definitions, including marketings and other disappearance.
- USDA NASS Hogs and Pigs — quarterly inventory and reproduction measures.
- CFTC COT release schedule — normal release time and position date.
- CFTC Disaggregated COT explanatory notes — trader categories and report methodology.
Disclosure: This article is for educational and informational purposes only. It is not individualized marketing, hedging, investment, financial, tax, legal, or insurance advice, or a recommendation to enter a particular transaction. Futures and options trading involves substantial risk of loss and is not suitable for every producer, hedger, or trader. Government data may be revised, and collection, calculation, or presentation errors may occur. Verify figures against their original sources. Government agencies do not endorse Ag Optimus or its interpretation of their data. Past performance and historical relationships are not indicative of future results.
