
From the Ag Optimus desk. This article is the opinion of Optimus Futures.
A hog producer needs to keep track of: how many pigs are coming, what packers are paying, what the consumer is pulling, what the rest of the world is buying — and how much product is sitting in the freezer. Five reports cover it, and none takes more than a few minutes to read.
Independent producers and farrow-to-finish operations own hog price risk directly — these reports and the futures market speak to them most. Contract growers paid per pig space carry mostly production and feed-side risk rather than hog price risk; for them, the feed half of this page (and our guide to grain market reports) may matter more than the hog half. Sorting out which risks are actually yours is the first marketing decision.
Key Takeaways
-
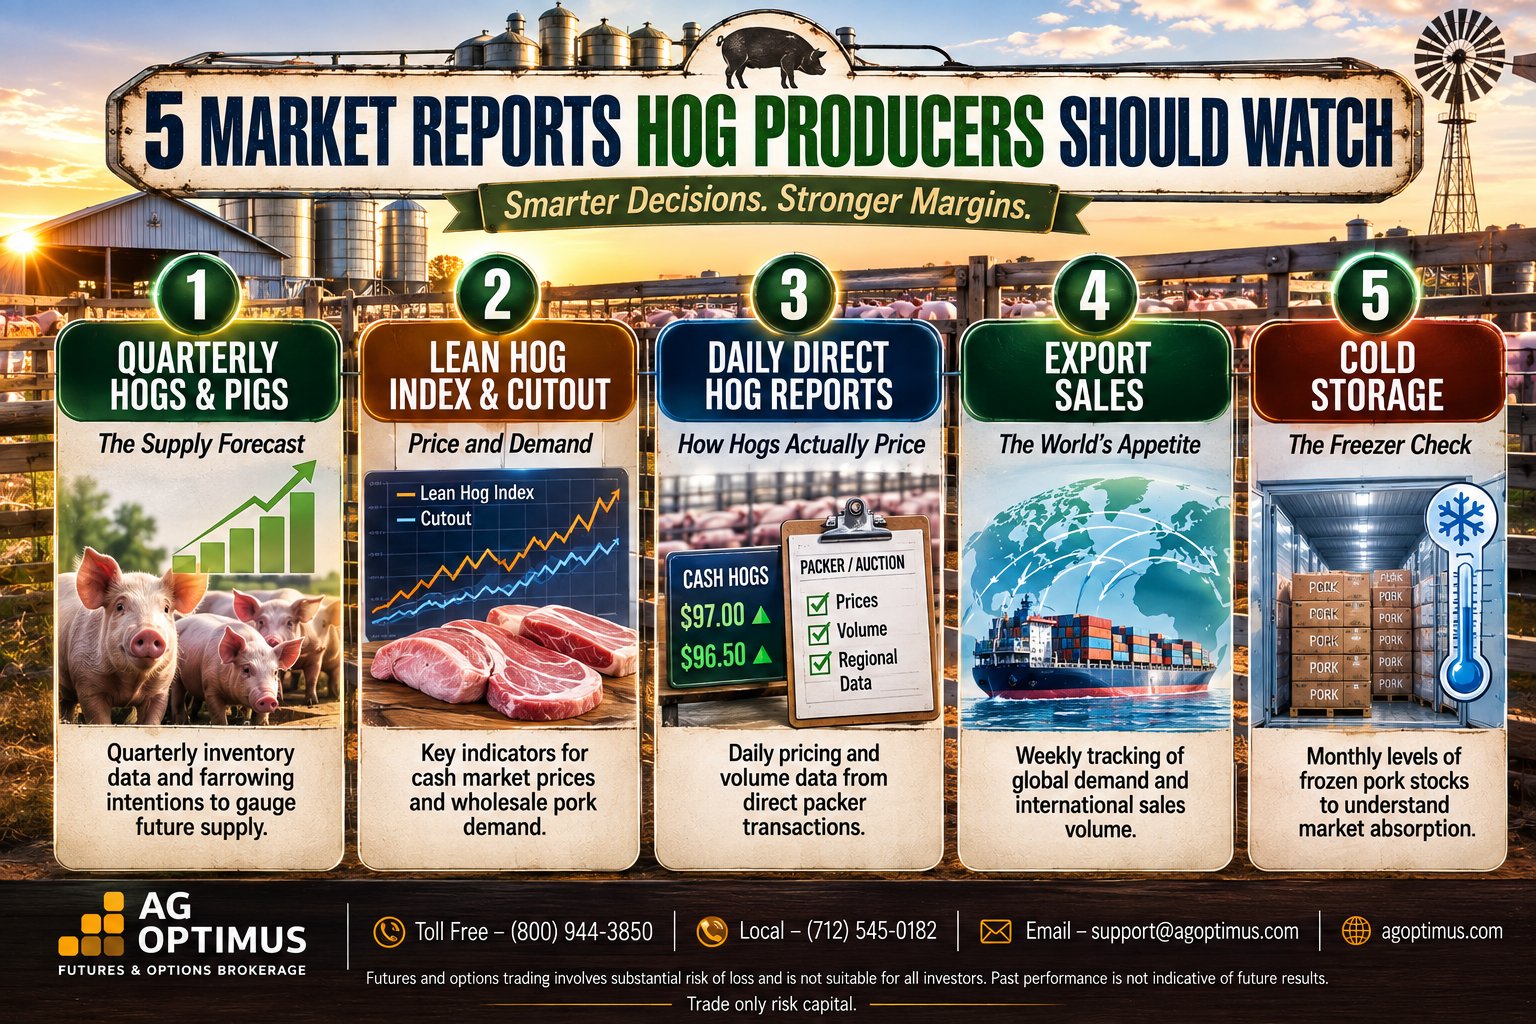
- Five hog market reports carry the story: the quarterly Hogs & Pigs report for supply, the Lean Hog Index and pork cutout for price and demand, the daily direct hog reports for how hogs actually price, Export Sales for the world’s appetite, and the monthly Cold Storage report for the freezer stocks behind it all.
-
- Hogs settle in cash. Lean hog futures are cash-settled to the CME Lean Hog Index, so the board converges to the Index at expiry — the gap between them is information, not an error.
-
- A hog operation sits on both sides of the margin. You sell hogs and buy corn and meal, so the feed reports matter as much as the hog reports, and the two conversations belong in the same plan.
1. The Quarterly Hogs & Pigs Report: The Supply Forecast
Four times a year — late March, June, September, and December — USDA’s National Agricultural Statistics Service publishes Hogs & Pigs — the inventory of the U.S. herd, split into the breeding herd and market hogs, with farrowing intentions and pigs saved per litter. It’s the hog market’s version of Cattle on Feed, and the trade grades it the same way — against pre-report analyst estimates, not against last year.
The breeding herd is the long lead: sows bred today are market hogs roughly a year out, so a growing or shrinking breeding herd is the closest thing pork has to a supply forecast. Pigs per litter is the quiet multiplier — productivity gains can expand supply even while the breeding herd shrinks; in late 2024, a record 11.92 pigs per litter more than offset a decline in farrowings and lifted the pig crop. And the market-hog inventory by weight group works like cattle placement weights: the heavy groups are the hogs that compete with yours over the next few weeks; the light groups arrive months later. Here’s a historical example. Iowa State’s Ag Decision Maker documented the September 2021 report, where the market-moving surprise wasn’t the headline — it was the light-weight groups, with pigs under 120 pounds coming in 4–6 percentage points below expectations. Winter lean hog contracts went limit-up the next session and stood roughly $8 higher a week later. Within two weeks they had given much of it back — a report can reprice supply overnight, but holding the move still depends on cash, exports, and feed.
2. The Lean Hog Index and the Pork Cutout: Price and Demand
Lean hog futures never deliver a hog. Each 40,000-pound contract is cash-settled to the CME Lean Hog Index — a two-day, carcass-weight-weighted average of actual producer-sold hog prices, built from USDA’s daily direct hog data — which means the board and the Index must meet at expiry. That single fact organizes everything. A futures price above the Index says the market expects cash to strengthen into that contract’s window; a discount says the opposite. The gap is a forecast you can read every day. One caution the trade learns early: the Index is a benchmark, not your check — plant grids, premiums and discounts, freight, and your contract’s formula all sit between the Index and what your operation actually nets.
The pork cutout — the value of the carcass as boxed pork, published daily by USDA Market News (report LM_PK602) — is the demand side. Loins, hams, and bellies each tell their own story, and the spread between the cutout and hog cost is the packer’s margin: when it widens, packers typically have room to bid for hogs. When it compresses, bids usually tighten first.
3. The Daily Direct Hog Reports: How Hogs Actually Price
USDA’s Agricultural Marketing Service publishes the national daily direct hog reports — including the prior-day slaughtered swine report (LM_HG201) that feeds the CME Index — covering negotiated purchases, formula trades, and base prices, morning and afternoon. The key structural point is how thin the negotiated trade is. Negotiated cash sales have run at a small single-digit share of producer-sold hogs in recent years, while the large majority move on formulas and contracts that reference those negotiated prices, the cutout, or the Index. And the Index itself uses only three of USDA’s purchase categories — negotiated, negotiated formula, and swine or pork market formula. That ties the settlement price of the futures market to the same thin trade these reports publish. A thin cash market setting the base for nearly everyone’s formula is the hog industry’s version of the leverage question, and it is why a few thousand negotiated head can matter to every check in the system. Producers on the forums put it more bluntly — complaints that a tiny negotiated trade benchmarks everyone else’s formula are a recurring theme — and while those are perceptions rather than USDA statistics, the underlying structure they describe is real. One vocabulary item prevents most formula confusion: USDA’s base price is before premiums and discounts; net price is after. Know which one your agreement references.
4. Export Sales: The World’s Appetite
A meaningful share of U.S. pork — roughly 30% of production in 2024 and 2025, per U.S. Meat Export Federation data — leaves the country, so the weekly Export Sales report from USDA’s Foreign Agricultural Service moves the board between domestic data points. Mexico anchors the trade on both volume and value; Japan is the high-value mature market; and China swings the widest — over 70% of shipments there are variety meats, and its purchases dropped more than 20% in 2025 alone. A market that buys the parts of the carcass with little domestic home can pressure the whole cutout when it steps back, even while loin and rib demand stays firm. Read the pace against USDA’s annual projection rather than reacting to one week. A single large sale makes a headline; a month of shipments running ahead or behind projection is what changes the balance sheet.
5. Cold Storage: The Freezer Check
Once a month, USDA’s Cold Storage report counts the frozen pork sitting in commercial warehouses at the end of the prior month — total stocks, and the lines the trade actually watches: bellies and hams. It is a lagging report by design, which is exactly its use: the daily cutout tells you what demand is doing right now, and the freezer tells you whether that story holds up. Stocks drawing down faster than the seasonal norm suggest demand is pulling harder than production; stocks building suggest product is backing up somewhere between the plant and the plate.
Seasonal patterns are the key to reading the data. Bellies typically build in the freezer through winter and spring, then draw hard through the summer sandwich season — which is why a thin belly number in late spring can precede sharp summer belly rallies, and why bacon headlines tend to trace back to this report. Hams build ahead of the fourth-quarter holiday features. Read every line against its own seasonal pattern and the year-ago figure, not in isolation — a big number in the wrong month means more than the same number in the usual one.
The Whole Routine on One Page
Five hog market reports, one steady rhythm: the quarterly inventory when it lands; the daily Index and cutout; the direct hog reports for price discovery; the export wire on Thursdays; and the monthly freezer check.
| Report & cadence | What to watch | What to do with it | What to discuss with your Ag Optimus broker |
|---|---|---|---|
| Hogs & Pigs Quarterly (NASS) | Breeding herd vs. a year ago; farrowing intentions; pigs per litter; market inventory by weight group. | Treat the breeding herd as a supply forecast roughly a year out, and the heavy-weight groups as your near-term competition. | What the supply outlook may mean for the quarters your hogs sell into, and whether floors on those marketing windows — futures, puts, or LRP — deserve a look before the trade fully prices the report. |
| Lean Hog Index & pork cutout Daily (CME / AMS) | The Index against the nearby board; cutout direction; the spread between cutout and hog cost. | Track convergence: futures settle to the Index, so the gap between them is the market’s forecast of where cash is headed. | What the board’s discount or premium to the Index implies for your marketing timing, and how your local basis has been running against the Index. |
| National Daily Direct Hog reports Daily (AMS) | Negotiated volume and prices; formula base values; the share of hogs trading negotiated versus formula. | Know which pricing bucket your hogs are in — a thin negotiated trade sets the base most formulas price from. | How your marketing agreement prices against these reports, and whether the mix of negotiated, formula, and hedged pricing still fits your operation. |
| Export Sales Weekly (FAS) | Net sales and shipments for pork; Mexico, Japan, and China headlines; pace against USDA’s projection. | Exports are the demand headlines that move the board between domestic data points — watch the pace, not one week. | Whether a demand surprise changes the picture for the deferred contracts your hogs price against, and what a tier of coverage costs while the board digests it. |
| Cold Storage Monthly (NASS) | Total frozen pork against a year ago; belly and ham stocks against their seasonal patterns. | Use it as the confirmation check on the cutout story — freezer draws tend to support it, builds call it into question. | Whether the freezer trend changes the picture for the summer belly season or the fourth-quarter windows your marketings price into. |
Both Sides of the Margin
A hog operation’s margin has two ends, and only one is a hog. Feed is the other part of the equation — corn and soybean meal — so the WASDE report, Crop Progress, and the grain positioning in our weekly COT coverage belong in a hog producer’s routine too. A corn rally like this August’s lands on your cost line whether or not you looked. The trade formalizes the idea as the lean hog crush — the spread between lean hog futures and the corn and soybean meal it takes to make them — a way of watching the feeding margin as one number instead of three. Seasonality belongs in the same planning conversation: hog prices have historically tended to run above their annual average from late spring through summer and below it through the fourth quarter and winter — a tendency, not a guarantee, but the reason Q4 coverage discussions typically start early. The reports on this page cover the revenue side; our guide to grain market reports covers the cost side; and the useful broker conversation covers both in one call — what a floor under fourth-quarter hogs and coverage on winter feed needs look like together, priced as one margin instead of two hopes.
Reading the reports is half the job. The other half is a plan with orders in it. Our brokers follow the hog market daily — the Index, the cutout, the export wires, the quarterly inventories — and talk through what it may mean for your marketings and your feed bill, both sides of the margin in one conversation.
Call us toll-free at (800) 944-3850 or locally at (712) 545-0182 to speak with an Ag Optimus broker.
Frequently Asked Questions
When is the Hogs & Pigs report released?
Quarterly — typically late March, June, September, and December — from USDA’s National Agricultural Statistics Service. Each release covers the full U.S. inventory: breeding herd, market hogs by weight group, farrowings, farrowing intentions, and pigs saved per litter.
Why are lean hog futures cash-settled?
Instead of delivering physical hogs, expiring contracts settle to the CME Lean Hog Index — a weighted average of actual cash hog prices built from USDA market-news data. Cash settlement means the board must converge to the Index at expiry, so the spread between futures and the Index is a readable market forecast of where cash could head.
What is the pork cutout?
The estimated value of a hog carcass sold as boxed pork — loins, hams, bellies, butts, ribs, and picnics — published daily by USDA Market News. It is the demand thermometer: the spread between the cutout and hog cost approximates the packer’s margin, which typically shapes how aggressively packers bid for hogs.
How are most hogs priced in the U.S.?
The large majority move on formulas, contracts, and packer-owned arrangements — negotiated cash sales have run at a small single-digit share of producer-sold hogs in recent years — and many of those formulas reference the thin negotiated trade or the cutout. That is why the daily direct hog reports matter even to producers who never sell a negotiated load: most agreements set reference prices there.
What is the Cold Storage report?
A monthly USDA report counting frozen meat stocks in commercial warehouses at the end of the prior month, including total pork and the belly and ham lines. It lags by design — its value is confirming or questioning the demand story the daily cutout tells, read against seasonal stock patterns and year-ago levels.
Do contract growers need these reports?
It depends on the risks the contract places on you. Growers paid per pig space typically carry little direct hog price risk, so the feed side of the operation may matter more than the hog market reports on this page. Independent and farrow-to-finish operations own the hog price risk these reports describe. A broker can help you sort that out in one conversation.
This material is general educational content from Ag Optimus, a DBA of Optimus Futures LLC, an introducing broker registered with the CFTC and a Member of the National Futures Association (NFA ID 0481133). Registration does not imply endorsement. This is not personalized trading advice or a recommendation to trade futures, options, or any other risk-management product. Published government and exchange data may be revised after release, and figures in examples are historical or hypothetical and for illustration. References to insurance-based products such as Livestock Risk Protection are informational; availability and suitability vary. Trading futures and options involves substantial risk of loss and is not suitable for all investors; you may lose more than your initial deposit. Past performance is not necessarily indicative of future results. Every operation is different; evaluate any decision against your own production costs, marketing plan, financial situation, and risk tolerance, and consult your broker regarding suitability.
