
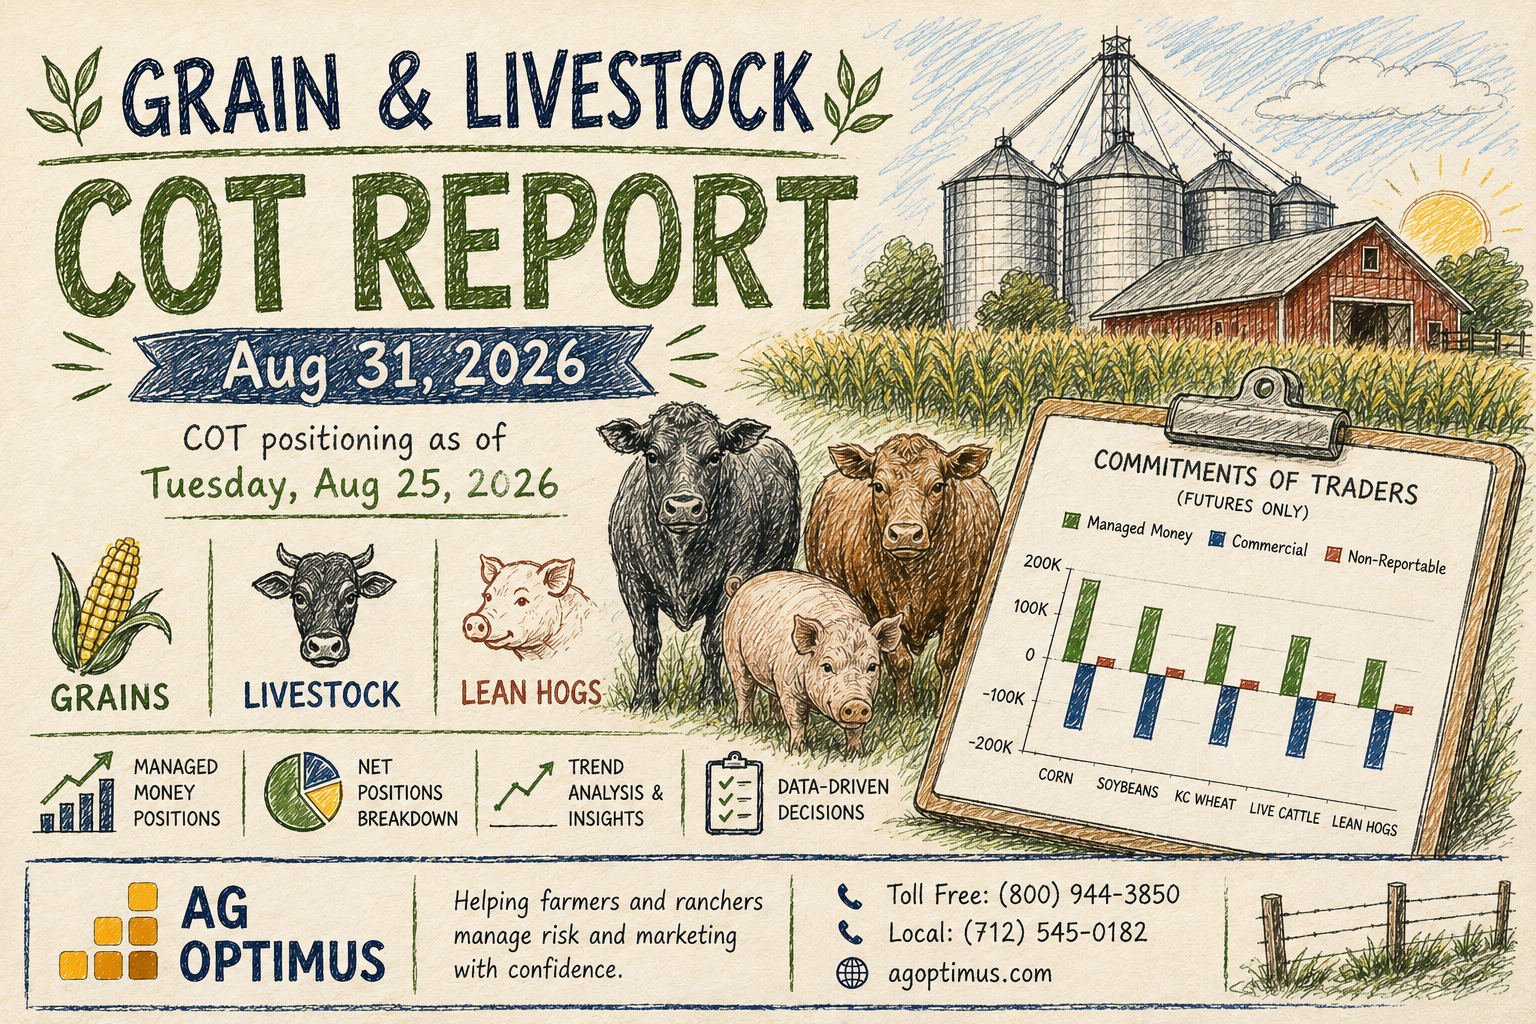
Read the timing gap. The COT numbers below are a snapshot of positioning as of the close on Tuesday, August 25, published the following Friday. The market commentary reflects trade since then. When the two disagree, positioning has likely already shifted.
Why we lead with Managed Money. Managed Money is the speculative money — funds and large traders positioning for a price move, not hedging a physical crop. When they crowd to one side, the market gets stretched, and stretched markets move hard when they turn. Commercials tell you where the grain is. Managed Money tells you where the risk is.
A quieter calendar, a louder tape. No Cattle on Feed, no WASDE, no crop tour this week — and the biggest positioning shifts we have recorded all summer happened anyway. Corn funds bought 126,008 contracts in one week, on top of 83,735 the week before. Feeder cattle posted a fourth straight lower weekly close. The absence of scheduled news did not make this a quiet week; it made it a positioning week.
The next scheduled catalyst is USDA Crop Production and WASDE on September 11, which settles the 669-million-bushel gap between Pro Farmer’s corn estimate and USDA’s. Cattle on Feed returns September 18. New to positioning data? Start with our guide to reading the COT report, and our August WASDE audit shows what the trade expected last month versus what USDA printed.
Feeder Cattle Post the Longest Losing Streak Since November
September feeders closed the week at $320.90, down $8.12 — a fourth consecutive lower weekly close and the longest losing sequence since last November. The actively traded October contract lost $10.325/cwt in the first two sessions alone, and the CME Feeder Cattle Index fell $3.01 on the day and $8.09 for the week as of the August 25 report.
Live cattle went with it: October settled at $211.72, down $6.20 on the week and also a fourth straight lower close. Cash was not uniformly weak — Wednesday business was reported near $220 live, about $2 above the prior day, with Northern dressed sales near $345. But the Fed Cattle Exchange reported no sales from roughly 2,000 head offered, with bids around $218 to $220. Cash firmness in pockets has not translated into confidence on the board.
The market is repricing placement economics from several directions at once: weaker fed cattle, corn back above $5, uncertainty around Mexican feeder-import implementation, and no clarity yet on where finished values settle.
What it means for the producer: A lower board can improve placement math — but only if feed cost and finished value cooperate, and corn just moved the wrong way on the first of those. This is a week to run breakevens against current numbers rather than the ones from three weeks ago, and to compare the board against your local cash feeder market rather than assuming they moved together. If you sell calves this fall, the four-week trend is the argument for having floors discussed now rather than after a fifth.
Corn CFTC 002602
The week: September corn closed Friday at $5.12, up 1¾ cents on the day and about 28 cents on the week. Support came from a sharper-than-expected decline in crop condition ratings, firm export activity, and attention to biofuel policy.
Last week’s record just got broken. Managed Money bought another 126,008 contracts — a 50.3% jump on top of the prior week’s 50.2% — taking the net long to 376,513. In three weeks the fund position has gone from 166,770 to 376,513: it has more than doubled. Commercials matched it in the other direction, selling 136,390 to reach 677,164 short, an extreme reading on their own 52-week scale and the largest commercial short this page has recorded.
| Tuesday | Commercials net | WoW Δ | Managed Money net | WoW Δ |
|---|---|---|---|---|
| Aug 4 | -493,223 | — | +181,946 | — |
| Aug 11 | -481,831 | +11,392 | +166,770 | -15,176 |
| Aug 18 | -540,774 | -58,943 ‡ | +250,505 | +83,735 ‡ |
| Aug 25 | -677,164 | -136,390 ‡ | +376,513 | +126,008 ‡ |
WoW Δ = the change in the net position from the prior week (week over week). ‡ marks a swing greater than 10% of the prior week’s net.
What it means for the producer: Last week this page said the crowded long and the September 11 report shared a calendar, and that the plan’s next tier should meet strength as a resting order. The crowd got substantially more crowded since. Two things are worth holding at once: the price is the best new-crop conversation in two and a half years, and the positioning behind it is the most one-sided we have seen. In our opinion, the risk is no longer whether the rally continues — it is what a 376,000-contract long does on a disappointing number. Your peers sold 136,390 contracts into this week. That is the loudest thing in the table.
Soybeans CFTC 005602
The week: September soybeans settled Friday at $12.76¼, up 19¾ cents on the day and roughly 51 cents on the week, with meal up $8.00 and oil up 259 points — strength across the whole complex. Soybean conditions were reported at 60% good-to-excellent, the lowest rating of the 2026 crop cycle.
The rebuild kept going. Managed Money added 46,592 contracts to 198,254, a 30.7% jump and the second consecutive week of heavy buying. In two weeks, the fund’s long has gone from 101,362 to 198,254 — it has nearly doubled. Commercials added 34,486 shorts to 275,497, their second straight week of double-digit percentage hedging into the rally.
| Tuesday | Commercials net | WoW Δ | Managed Money net | WoW Δ |
|---|---|---|---|---|
| Aug 4 | -231,685 | — | +125,466 | — |
| Aug 11 | -210,608 | +21,077 | +101,362 | -24,104 ‡ |
| Aug 18 | -241,011 | -30,403 ‡ | +151,662 | +50,300 ‡ |
| Aug 25 | -275,497 | -34,486 ‡ | +198,254 | +46,592 ‡ |
WoW Δ = the change in the net position from the prior week (week over week). ‡ marks a swing greater than 10% of the prior week’s net.
What it means for the producer: Three Fridays ago beans were $11.59 and this page called the window a second chance. It is now $12.76¼ — a dollar and change higher — and the second chance has run further than most plans assumed. That is the good news and the caution in one sentence. Commercials have now sold into two consecutive weeks of this move, and the crop still faces energy-market weakness, thinner crush margins, and biofuel policy uncertainty on the other side of the ledger. If tiers belonged at $11.92, they belong here with more conviction, not less.
Wheat CFTC 001602 · CHICAGO SRW
The week: September Chicago wheat closed Friday at $7.67, up 24¼ cents on the day and up 85½ cents on the week — by some distance the largest weekly move this page has recorded in any market. Wheat opened the week at $6.81½ and never looked back. Black Sea shipping and export uncertainty did the work; a faster spring-wheat harvest and a brief easing of geopolitical concern pressured it midweek, and export-risk headlines brought buyers back hard before the weekend.
The short came apart, and the price followed. Managed Money bought back 12,314 contracts — a 46.5% cut — taking the net short from 26,485 to 14,171. Across two weeks, the fund short has more than halved, from 31,401 down to 14,171, and the board rose 85½ cents in the second of those weeks. This is what a short-covering rally looks like when it stops being theoretical. Commercials went the other way again, adding 5,826 shorts to 67,555 and extending a month-long pattern of selling into every bounce — including this one.
| Tuesday | Commercials net | WoW Δ | Managed Money net | WoW Δ |
|---|---|---|---|---|
| Aug 4 | -50,214 | — | -23,786 | — |
| Aug 11 | -48,873 | +1,341 | -31,401 | -7,615 ‡ |
| Aug 18 | -61,729 | -12,856 ‡ | -26,485 | +4,916 ‡ |
| Aug 25 | -67,555 | -5,826 | -14,171 | +12,314 ‡ |
WoW Δ = the change in the net position from the prior week (week over week). ‡ marks a swing greater than 10% of the prior week’s net.
What it means for the producer — with a scorecard. Last week this page said a short-covering rally runs until the shorts are gone and does not send an invitation before it ends. The direction was right, and the urgency was wrong: anyone who read that as a reason to sell at $6.81 left 85½ cents on the table. We would rather say that plainly than let it pass. What is true now is arithmetic rather than opinion — there are 14,171 contracts of spec short left to buy, against 31,401 a fortnight ago, so most of the fuel behind this move has already burned. The commercial column has sold into every week of it, including an 85-cent week. In our opinion, a market this far and this fast off its lows is a place to have tiers working above the market rather than a single decision made in either direction.
Feeder Cattle CFTC 061641
The week: September feeders closed Friday at $320.90, down $1.55 on the day and $8.12 on the week — a fourth straight lower weekly close. The October contract dropped $10.325/cwt across the first two sessions, and the CME Feeder Cattle Index fell $8.09 on the week.
Commercials are now essentially flat. Producers covered another 2,715 contracts — an 88.1% swing — taking the commercial net short to just 368 contracts, down from 5,746 a month ago. That is as close to flat as this column gets, and it sits at their bullish extreme for the year. Managed Money cut 1,784 more longs to 5,714, a 23.8% reduction and the second straight week of specs stepping back.
| Tuesday | Commercials net | WoW Δ | Managed Money net | WoW Δ |
|---|---|---|---|---|
| Aug 4 | -5,746 | — | +8,605 | — |
| Aug 11 | -5,525 | +221 | +8,738 | +133 |
| Aug 18 | -3,083 | +2,442 ‡ | +7,498 | -1,240 ‡ |
| Aug 25 | -368 | +2,715 ‡ | +5,714 | -1,784 ‡ |
WoW Δ = the change in the net position from the prior week (week over week). ‡ marks a swing greater than 10% of the prior week’s net.
An honest scorecard. Last week this page read the commercial extreme as pointing to better downside support. The board then fell $8.12 and posted a fourth straight lower close. The positioning read was accurate as a description — hedgers really were unwilling to sell down here, and they kept covering all the way through the break — but it did not stop the decline, and we should say so plainly. Hedgers refusing to add shorts tells you where the physical trade values cattle. It does not tell you what specs, cash, and import headlines will do to the board in the meantime. That distinction is the whole reason this page says positioning describes the market rather than predicts it, and this week it cost real money to anyone who read it the other way.
Live Cattle CFTC 057642
The week: October live cattle settled Friday at $211.72, down $1.20 on the day and $6.20 on the week — a fourth consecutive lower weekly close. Cash showed pockets of strength near $220 live and $345 dressed in the North, but the Fed Cattle Exchange moved nothing from roughly 2,000 head offered.
Four straight weeks of specs leaving, one contract at a time. Managed Money trimmed another 4,073 to 57,441 — the fund long has now fallen every week since July 28, from 66,523 down to 57,441. Commercials covered 3,550 to 105,470 short, continuing to lift hedges into weakness. Neither side moved more than 10% this week; the repositioning has been steady rather than violent, even as the board dropped $6.20.
| Tuesday | Commercials net | WoW Δ | Managed Money net | WoW Δ |
|---|---|---|---|---|
| Aug 4 | -114,088 | — | +66,067 | — |
| Aug 11 | -116,155 | -2,067 | +64,662 | -1,405 |
| Aug 18 | -109,020 | +7,135 | +61,514 | -3,148 |
| Aug 25 | -105,470 | +3,550 | +57,441 | -4,073 |
WoW Δ = the change in the net position from the prior week (week over week). ‡ marks a swing greater than 10% of the prior week’s net.
What it means for the producer: The same lesson the feeder table just taught, one contract over. Hedgers have covered for three straight weeks, and specs have sold for four, and the board still lost $6.20 — orderly positioning does not mean a stable price. What the table does say is that nobody is being forced: no >10% swings, no liquidation cascade, cash firm in pockets even as futures fall. For fall marketings, that argues for pricing decisions made on your breakeven and your cash market rather than on the board’s four-week trend. The $222 to $223 cash area is still the reference worth watching.
Lean Hogs CFTC 054642
The week: October hogs closed Friday at $81.90, up $1.27 on the day and $1.02 on the week — snapping a four-week losing streak. Cash was mixed underneath: the national average fell $4.87 in one session, and the Lean Hog Index slipped 40 cents, while the pork cutout rose $1.18 to $99.93, a two-week high.
Three straight weeks of building, and the tank is full. Managed Money added another 7,649 shorts to 31,135 — a 32.6% jump following swings of 56.8% and 55.3%. In three weeks, the fund’s shorts have gone from 9,642 to 31,135, more than tripling. Commercials covered another 3,745 to 35,008, their third consecutive week of lifting hedges. The two columns have now converged: specs short 31,135, hedgers short 35,008, moving in opposite directions.
| Tuesday | Commercials net | WoW Δ | Managed Money net | WoW Δ |
|---|---|---|---|---|
| Aug 4 | -53,580 | — | -9,642 | — |
| Aug 11 | -48,296 | +5,284 | -15,121 | -5,479 ‡ |
| Aug 18 | -38,753 | +9,543 ‡ | -23,486 | -8,365 ‡ |
| Aug 25 | -35,008 | +3,745 | -31,135 | -7,649 ‡ |
WoW Δ = the change in the net position from the prior week (week over week). ‡ marks a swing greater than 10% of the prior week’s net.
What it means for the producer: This page has tracked the tank refilling for three weeks and called the setup a squeeze architecture. Friday was the first session that looked like the architecture mattering — a $1.27 bounce off a four-week slide, with the cutout at a two-week high, into the largest spec short of the summer. It is one day, and the cash average fell $4.87 in the same stretch, so this is a hint rather than a turn. The plan does not change on a hint: orders resting through the $80–$85 range, floors priced while the board holds above $80. What has changed is the asymmetry — 31,135 contracts of shorts have to buy eventually, and they will not do it slowly.
The bigger picture
The split this page described two weeks ago has not just held — it has gone to extremes in both rooms. In grain, funds bought 172,600 corn and bean contracts in a single week while producers sold 170,876 against them, and the corn commercial short reached 677,164, the largest we have recorded. In livestock, hedgers kept covering in all three markets and are now essentially flat in feeders, while specs kept leaving live cattle and kept piling into hogs. Wheat delivered the sharpest proof of the pattern: funds cut their short nearly in half, the board ran 85½ cents, and producers sold into it anyway. Grain hedgers are selling strength. Livestock hedgers are buying weakness. Six weeks running.
What this week added is a caution about how to read that. The livestock hedgers were right about value and wrong about timing: they covered all the way down while feeders lost $8.12 and live cattle lost $6.20. Positioning describes the market; it does not predict it. A commercial extreme tells you what the physical trade thinks cattle are worth. It does not tell you what the board does between now and when that view gets settled, and this week the gap between those two things was expensive.
The grain side carries the mirror-image version of the same warning. A 376,000-contract corn long and a 198,000-contract bean long are not predictions either — they are a description of how much money is leaning one way going into a scheduled event. September 11 resolves a 669-million-bushel disagreement between Pro Farmer and USDA, and it arrives with the most one-sided positioning of the year behind it.
None of this prices your grain or sells your cattle — your breakeven, your basis, and your own marketing plan do. Call us on the number below.
Positioning data is from the CFTC Commitments of Traders report for the week ended Tuesday, August 25, 2026. Market commentary reflects publicly reported trade and is drawn from public industry sources; verify all price levels against your own quote provider. USDA does not endorse, certify, or approve this analysis, Ag Optimus, or Optimus Futures LLC, and the use of USDA data here does not imply any such endorsement. This material is provided for general information and is the opinion of Ag Optimus. Trading futures, options, and swaps involves substantial risk of loss and is not suitable for all investors. Past performance is not necessarily indicative of future results. Optimus Futures does not maintain a research department as defined in CFTC Rule 1.71. Ag Optimus is a registered DBA of Optimus Futures LLC [NFA ID 0481133]. All trading decisions remain yours.
