
From the Ag Optimus desk. This article is the opinion of Ag Optimus.
The Cattle on Feed report is the cattle market’s monthly supply scorecard — and probably, in our opinion, the most misread of the major USDA releases. For a producer, the value isn’t whether the headline sounds bullish or bearish. It is timing: is the supply of market-ready cattle getting tighter or more burdensome in the months ahead — and does that change anything in my marketing plan?
This guide covers how to read the Cattle on Feed report the way a producer should: the three headline numbers, why placements move the board, what the weight breakdown says about timing, and what the findings mean for feeders, fed-cattle sellers, and cow-calf operators. It is the companion piece to our guide on cattle feeder market reports, which anchors the monthly routine.
Key Takeaways
-
- It is a timing report. Placements represent cattle entering the pipeline, roughly 4 to 6 months from market; the weight mix indicates when they arrive; marketings show how quickly cattle are leaving.
-
- The report is graded against expectations, not last year. A placement figure of 102% (for example) of a year ago can be bullish, bearish, or neutral depending entirely on what analysts expected before the release.
-
- It is a planning input, not a signal. The same report reads differently for a feeder buying cattle, a feedlot selling them, and a cow-calf operation selling calves — and the quarterly heifer numbers tell the herd-cycle story.
How the Report Works
USDA’s National Agricultural Statistics Service publishes Cattle on Feed monthly, normally on the third Friday at 2:00 p.m. Central. It surveys feedlots with capacity of 1,000 head or more — roughly 2,000 operations that account for about 85% of the fed cattle in the country. Three numbers carry the headline.
| Number | What it measures | Period & reporting |
|---|---|---|
| Cattle on feed | Steers and heifers in surveyed feedlots being fattened for slaughter. | Inventory as of the first of the month; head count and percent of a year ago. |
| Placements | Cattle and calves placed in feedlots and fed to reach a Select or better carcass grade. | The full prior month; percent of the same month last year. |
| Marketings | Fed cattle shipped from feedlots to slaughter. | The full prior month; percent of the same month last year. |
Placements: The Number That Moves the Board
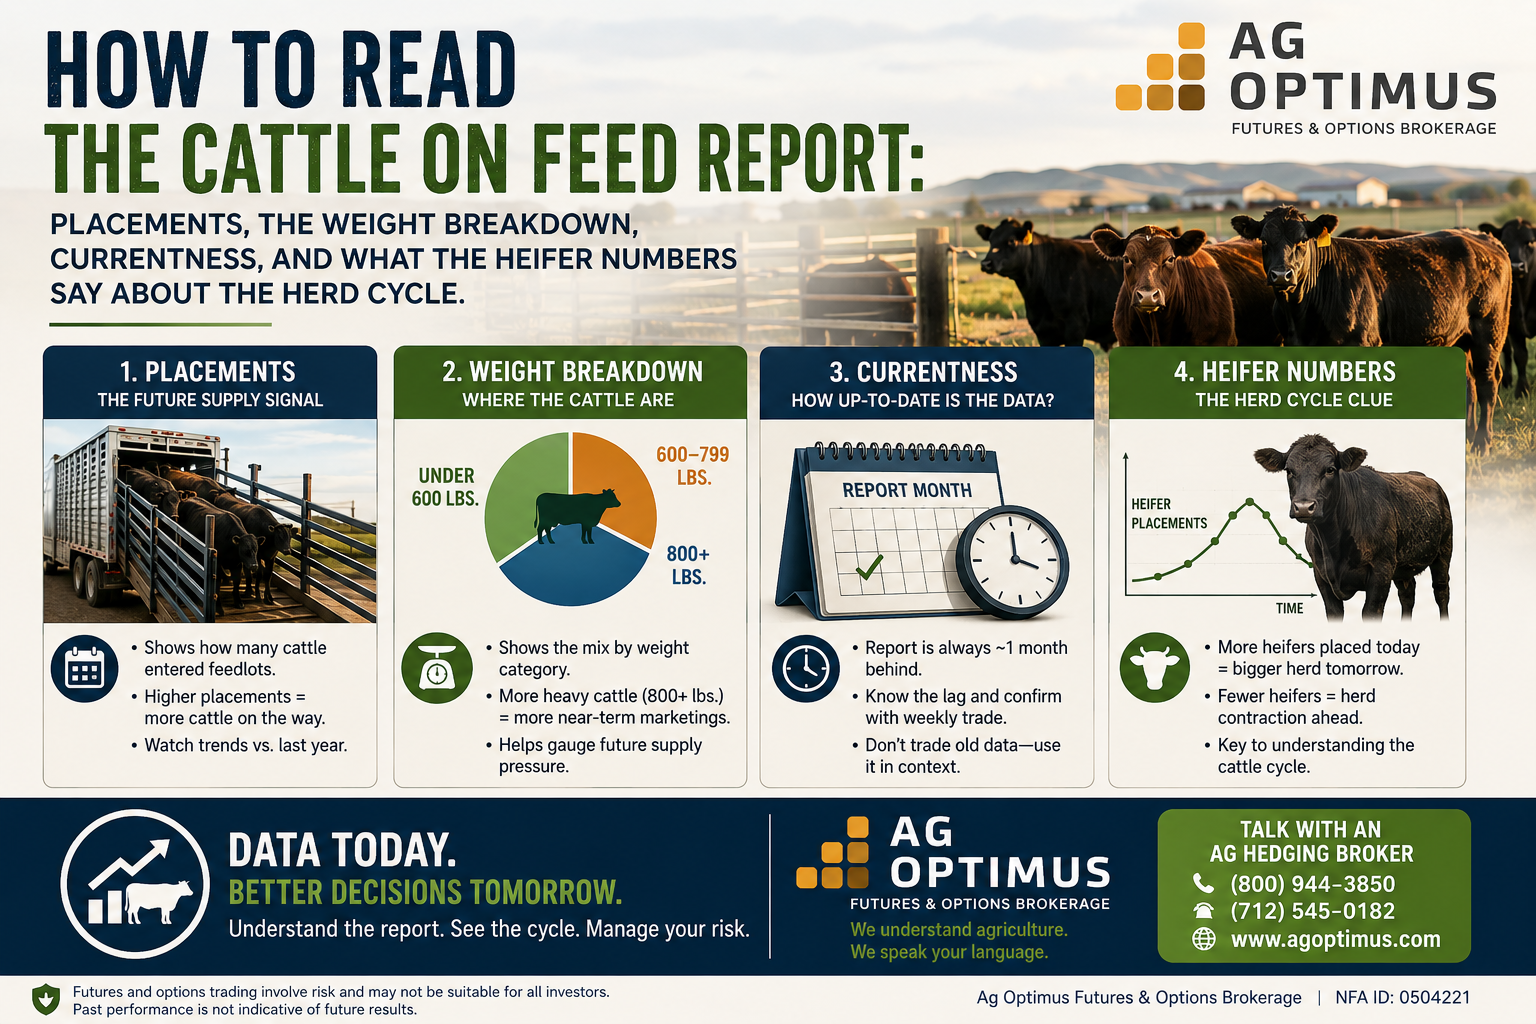
Placements are the market’s early look at future supply: cattle placed today reach market weight roughly four to six months out, with the exact timing set by placement weight, feed costs, weather, and how current the feedlot runs. That forward window is why the deferred live-cattle contracts — the months further down the board, where these cattle will finish — tend to respond first, along with the feeder market that supplies the cattle.
The board doesn’t respond to the raw number — it responds to where the number lands against pre-report estimates. Analysts publish expectations before every release, and the actual number is judged against that range. Iowa State’s Ag Decision Maker documented a clean historical example: ahead of the June 2024 report, analysts expected May placements to be near 98.3% of the prior year, with the full range topping out at 102.4%. USDA reported 104.3% — above every estimate on the street — and the market treated it as a genuine supply surprise. The percentages sound small until you make the conversion: a two-point miss could represent more than 50,000 head the trade didn’t know were on their way.
The Weight Breakdown: When the Cattle Arrive
Total placements show how many cattle entered the pipeline. The weight breakdown indicates when they’ll reach market. Lighter placements require months of feeding before their supply arrives, while heavier placements are close to finished and market sooner. The same total can weigh on nearby contracts — those closest to today — or on deferred ones, depending entirely on the mix.
| Placement mix | Likely implication | Why |
|---|---|---|
| More lightweight (under 700 lb.) | More fed-cattle supply later. | Calves need more days on feed before reaching market weight. |
| More heavyweight (800 lb. and up) | More fed-cattle supply sooner. | Heavier cattle are closer to finish and market earlier. |
| Fewer lightweight | Potentially tighter deferred supply. | Fewer cattle entering the long end of the feeding pipeline. |
| Fewer heavyweight | Potentially tighter nearby supply. | Fewer cattle close to finishing are joining the front of the queue. |
This detail explains the report days when the market seems to ignore the headline. A big placement month at or below 700 pounds is typically a deferred story that the market can absorb over time. For example, the same total concentrated above 800 pounds means cattle joining the front of the queue — and the nearby contracts tend to take that news personally.
Marketings and Currentness: How Fast Cattle Are Leaving
Marketings show the pace of cattle shipping to slaughter — but adjust for the calendar before judging them. One fewer slaughter day lowers a monthly total even when the daily pace never changed, which is why University of Nebraska extension work recommends comparing marketings per slaughter day.
Compare marketings against inventory, and you get the market’s working estimate of currentness — how caught up feedlots are on marketing finished cattle: keeping up, or backing up. The report carries no official days-on-feed figure — the trade infers it from placements by weight, inventory, marketing pace, and carcass weights. The stakes are leverage: current feedlots can tell a packer no on a bid, while backed-up feedlots holding heavy cattle typically negotiate from a position of weakness. A large on-feed inventory alone proves nothing: it can mean cattle backing up, or just longer feeding to heavier weights. The pace of marketing separates the two readings.
Three Producers, Three Different Reports
Buying feeder cattle: the report frames both sides of your margin. Placements below expectations tend to support the deferred live-cattle board your finished cattle will sell against — which can improve the margin you can build today. But strong placements also mean feedlots have been bidding actively for cattle, which supports the cash feeder market you are buying in. Weigh the deferred board against your projected sale month, the feeder board against cash and the CME Feeder Cattle Index, and your ration-cost risk — the margin is only real when all three legs hold together.
Selling fed cattle: for the nearby board, check marketings per slaughter day, currentness, and the heavyweight placements of recent months — those are the cattle competing with yours for packer attention. Slow marketings, heavy placements nearing finish, and rising weights can stack the deck against the nearby board; strong movement and manageable inventory may support it. The response is rarely as blunt as selling futures — it’s reviewing cash targets, basis contracts, floors, and what share of projected marketings already has coverage.
Selling calves: feedlots are the demand base for your calf crop, so their behavior in this report is an early read on your market. Aggressive placement can support the feeder market you sell into this fall — while also building the fed-cattle supply that may eventually cap it. Thin placements can mean tight future supply — or just that feeding margins are too poor to bid for cattle. Pair the report with the feeder board for your sale window and the Feeder Cattle Index — and remember the Index settles futures in cash: your calves differ from Index cattle by weight, sex, location, and program, and that difference is basis risk the report cannot see. Our guide to cattle market reports covers that weekly routine.
The Report-Day Playbook
Different headlines set up different conversations. None of these are trade signals: the middle column describes how markets have usually responded, not how they must, and the last column gives you the conversation to start with your broker.
| The report says | What it typically means for the board | What to discuss with your Ag Optimus broker |
|---|---|---|
| Placements above the expected range | More future fed-cattle supply than the trade priced in — deferred live cattle often come under pressure. | What the deferred board now pays against your projected finish months, and whether coverage on cattle you will market in that window — futures, puts, or LRP — warrants a fresh look at these levels. |
| Placements below the expected range | A tighter forward pipeline — often supportive for deferred contracts, and sometimes for the feeder market. | Whether a supportive deferred board improves the margin you can build today — buying feeders against a hedgeable sale month — and what tier of that margin is worth putting on now. |
| Heavyweight placements surge | Supply arrives sooner: more near-finished cattle tend to pressure the nearby contracts rather than the deferred. | How the nearby-versus-deferred spread affects your marketing window — and whether cattle close to finish should be priced ahead of the crowd they just joined. |
| Marketings slow against inventory | Currentness eroding — cattle backing up tends to shift leverage toward packers and weigh on cash. | Where your fed cattle sit against the backlog, whether pulling marketings forward fits, and what floors under later sales would cost while the board still holds. |
| Quarterly heifer share shifts | A rising heifer share typically signals liquidation; a falling share can signal retention — and potentially tighter calf supplies about two years out. | For a cow-calf operation: what the herd-cycle signal means for the calves you will sell over the next two falls, and whether feeder futures or LRP fit those windows. |
Heifers on Feed: The Herd-Cycle Signal
Once a quarter, the report separates the on-feed inventory into steers and heifers — and in our opinion, that split is the closest thing cattle markets have to a two-year weather forecast. A high share of heifers on feed means potential replacement females are being fed for slaughter rather than kept back for breeding — liquidation. A falling share means retention — heifers going back to pasture to build the herd — which can tighten today’s feeder supply while pointing to more calves roughly two years out.
Use it with caution, though. Heifer numbers also move with dairy-beef flows, drought forcing females off pasture, and imports — in late 2025, reduced Mexican feeder imports under the screwworm restrictions muddied the retention signal considerably. Cross-check it against the semiannual Cattle Inventory report, cow slaughter, and pasture conditions before treating one quarter’s split as the cycle turning.
Mistakes to Avoid
Trading the percentage without the head count. Placements are fiercely seasonal — a 5% jump in a small-placement month can be fewer actual cattle than a 2% change during the big fall runs. Convert percentages to head, check the seasonal pattern, and count the slaughter days.
Skipping the revisions. USDA revises prior months, so read the revision notes before the new number — a friendly headline against an upwardly revised base is less friendly than it looks.
Confusing on-feed inventory with beef production. Production also depends on carcass weights, cow and dairy-beef slaughter, packing capacity, and cattle outside the surveyed lots. Large inventories can coexist with tight supplies of market-ready cattle if the cattle are light or slow-moving.
Expecting the market to obey the headline. Futures can fall on a “bullish” report that falls short of even more optimistic expectations, or when cash markets, boxed beef, corn, or fund flows overwhelm it. The surprise against expectations — and everything else moving that Friday — decides the reaction, not the adjective.
The Most Important Rule
Read Cattle on Feed as a timing report, not a verdict on price. Placements indicate what is entering the pipeline, the weight mix shapes as it surfaces, and marketing shows how fast the pipeline drains. What matters is never whether the report is “bullish” — it’s whether it changed the supply outlook for the months your cattle sell into, and whether your written plan needs updating. Our guides to the COT report and the WASDE report ask the same question of positioning and feed costs — the three reports together frame both sides of a cattle margin.
The third Friday of every month, this report can re-price the cattle you own. Our brokers read it the afternoon it drops, compare placements against expectations, check the weight and heifer breakdowns, and talk through what it means for cattle on your operation — whichever side of the feedyard gate you sit on.
Call us toll-free at (800) 944-3850 or locally at (712) 545-0182 to speak with an Ag Optimus broker.
Frequently Asked Questions
When is the Cattle on Feed report released?
Monthly, normally the third Friday at 2:00 p.m. Central, from USDA’s National Agricultural Statistics Service. Each release shows on-feed inventory as of the first of that month plus placements and marketings for the prior month.
What are placements in the Cattle on Feed report?
Cattle and calves that entered surveyed feedlots during the month, placed on a ration intended to finish them for slaughter at Select grade or better. Placements are the market’s early read on fed-cattle supplies roughly four to six months ahead, which is why they are the most closely watched line in the report.
Why did cattle futures fall after a bullish Cattle on Feed report?
Because the report is graded against pre-report expectations, not last year. A placement number below year-ago levels can still exceed what analysts forecast — more supply than the trade priced in — and the market can also be moved that same Friday by cash trade, boxed beef, corn, or fund positioning. The surprise, more than the adjective, typically decides the reaction.
What do placement weights mean in the report?
USDA breaks placements into six weight groups, ranging from under 600 pounds to over 1,000 pounds. Lighter placements need more months on feed — supply arriving later; heavier placements are close to finished — supply arriving soon. The mix tells you whether a placement total pressures the nearby contracts or the deferred ones.
What does currentness mean for cattle feeders?
It describes how caught up feedlots are on marketing finished cattle. Current feedlots — strong marketings against inventory — can walk away from weak packer bids. Backed-up feedlots holding heavy cattle have far less room to move. The report carries no official days-on-feed number; the trade infers currentness from marketings, inventory, placement weights, and carcass weights.
What do heifers on feed tell you about the cattle cycle?
The quarterly steer-heifer split is a herd-cycle indicator: a high heifer share means females are being fed rather than retained — liquidation — while a falling share can signal retention and, roughly two years later, potentially more calves. Confirm it against the Cattle Inventory report, cow slaughter, and pasture conditions; imports and dairy flows can blur one quarter’s reading.
Does the report cover every feedlot?
No — it surveys feedlots with 1,000-head-plus capacity, roughly 2,000 operations covering about 85% of fed cattle. Smaller farmer-feeder lots are excluded, so on-feed inventory and total beef production are not the same number.
This material is general educational content from Ag Optimus, a DBA of Optimus Futures LLC, an introducing broker registered with the CFTC and a Member of the National Futures Association (NFA ID 0481133). Published government estimates may be revised after release, and figures in the examples are historical or hypothetical and for illustration only. References to insurance-based products such as Livestock Risk Protection are informational; availability and suitability vary. Trading futures and options involves substantial risk of loss and is not suitable for all investors; you may lose more than your initial deposit. Past performance is not necessarily indicative of future results. Every operation is different; evaluate any decision against your own production costs, marketing plan, financial situation, and risk tolerance, and consult your broker regarding suitability.
