
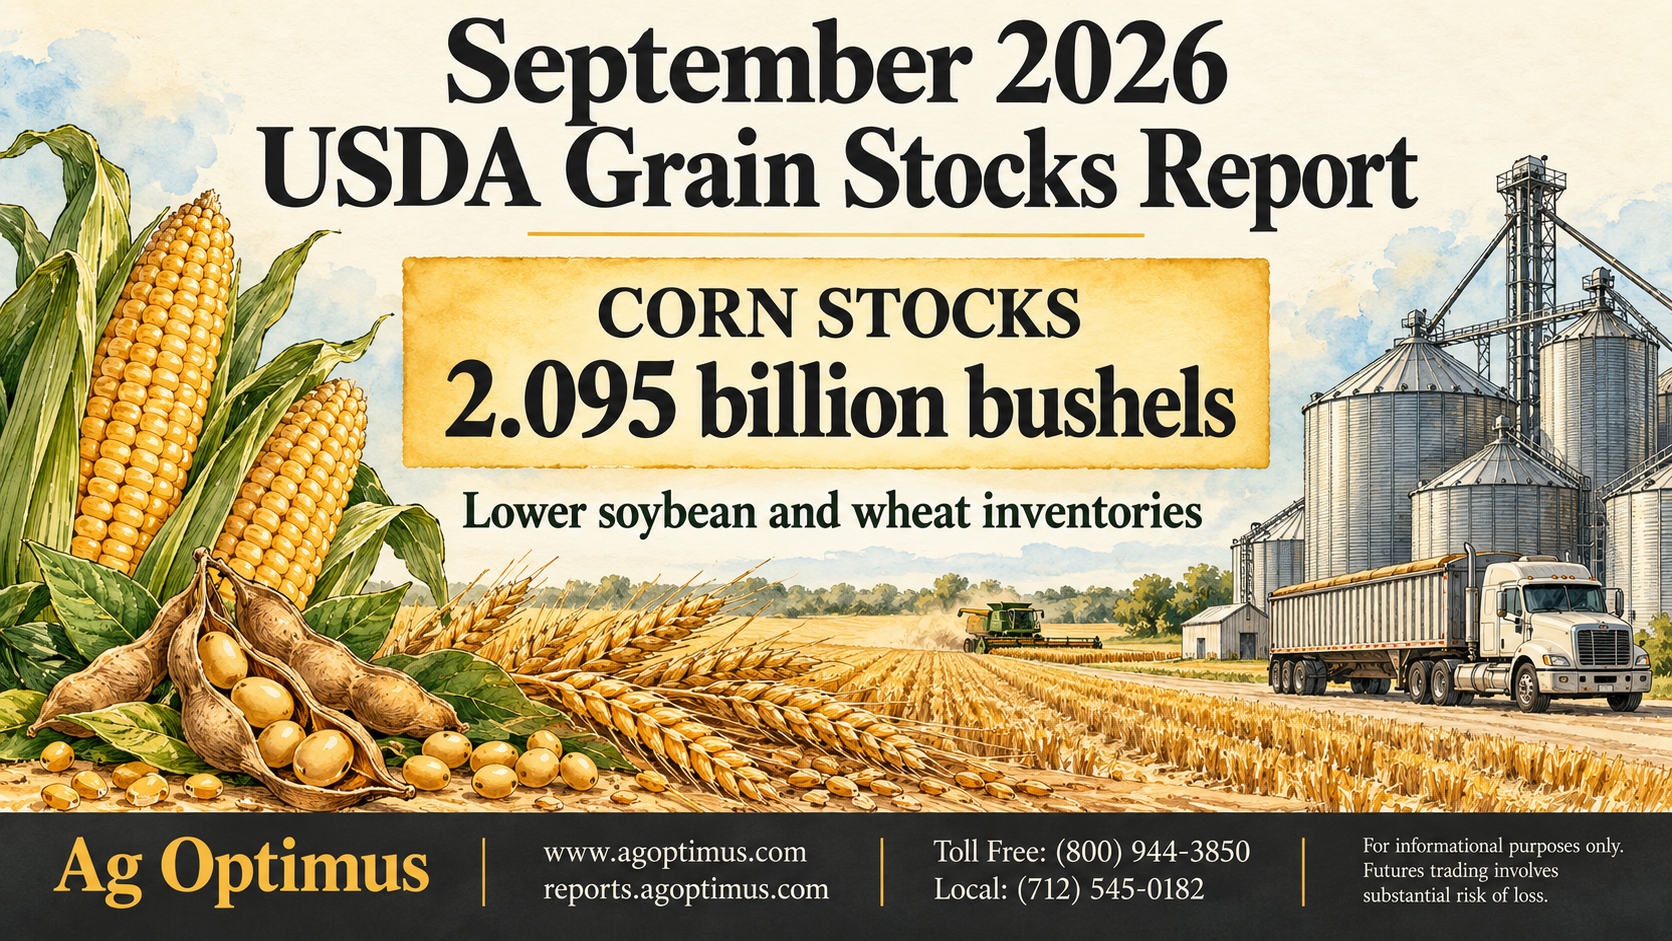
USDA counted 2.095 billion bushels of corn on hand September 1, up 35% from a year ago and above every pre-report survey. Soybean stocks fell 3% to 315 million bushels and all-wheat stocks fell 13.5% to 1.846 billion — both slightly under expectations. This was a corn-specific surprise, not a grain-wide one.
The analysis is below, and it is worth reading. But if you have a combine running and need a decision before the weekend, these three numbers answer it: what the carry pays, what storage costs you, and how far apart your local bids are.
Store or sell: what the carry actually pays
The market tells you what it will pay you to hold grain. Compare that against what holding costs you, and the decision stops being a guess.
| Corn contract | Sept 30 settle | Carry |
|---|---|---|
| December 2026 | $5.00¾ | baseline |
| March 2027 | $5.15½ | +14¾¢ |
| May 2027 | $5.23¼ | +7¾¢ over March |
So December to March pays 14¾ cents. Here is what three months of holding costs are, using a cash price of about $4.60 — which is December futures less the 40-cent national average basis reported this week.
| Interest — $4.60 at 7% for three months | 8.1¢ |
| Commercial storage at 3–5¢ per month | 9–15¢ |
| Total, commercial storage | 17–23¢ |
| On-farm variable costs — power, fans, shrink, handling | about 4¢ |
| Total, on-farm with bins already paid for | about 12¢ |
Commercial storage does not pay at this carry. Fourteen and three-quarter cents against a cost of 17 to 23 cents is a loss of 2 to 8 cents a bushel, before any basis change. It only works if you expect basis to improve enough to cover the gap.
On-farm storage does pay, narrowly — if the bins are already paid for and your variable costs really are near 4 cents. Roughly 12 cents of cost against 14¾ cents of carry, plus you skip the harvest basis penalty. Run your own numbers rather than ours; drying costs this year are the variable that moves it.
What the research says about waiting. A University of Illinois study of 136 elevators across 12 states from 2010 to 2025 found corn basis averages about 11 cents per bushel weaker at harvest than in late November. That is the number to hold against your storage cost — it says what the market has historically paid for patience, and it is close enough to the carry that the decision is genuinely marginal rather than obvious.
What to do, by situation
If you still have old-crop corn in the bin
This is the position the report hurt most. Elevators are holding 44% more corn than a year ago, so they have little reason to bid aggressively for old crop sitting alongside new crop arriving at the scale. Check your local old-crop bid against the new-crop delivery bid. If the old crop is not commanding a premium, there is little reason to keep it, and grain carried since fall 2025 has condition risk that only grows.
If you are harvesting now
Your decision is the carry table above, run with your own storage cost.
Corn basis was reported at 40 cents under December nationally this week. Inside Iowa alone, northeast country elevators were quoted 60 to 15 cents under, and southeast between 69 and 40 cents under.
That is a 54-cent spread in one state. On a 1,000-bushel load, it is $540 for the price of a few phone calls, and it is worth more than any view on where December corn is going.
If you have unpriced new crop
Hold two things together. The carry-in is 173 million bushels larger than USDA assumed, and the implied feed shortfall could push the October 9 balance sheet looser still. Against that, the 2026 crop is still projected smaller at 15.8 billion bushels on 178.5 bushels per acre, and harvest is only 18% complete — the yield question is not settled. In our opinion, this is a week to decide the prices at which you would sell rather than to sell into the move, and to talk with your broker about what a floor costs at these levels before October 9 rather than after.
If you buy corn to feed
The position is better than it was a week ago. A 21-cent break with elevators full and basis soft across the Belt is the kind of window that closes when harvest ends, not when the news improves. Worth discussing basis contracts for fourth-quarter and first-quarter needs with your supplier while terminals want bin space, and worth asking your broker how to keep some upside exposure if October 9 brings a yield cut.
USDA also revised the 2025 corn crop down 57 million bushels, to 16.964 billion. So more corn is sitting in storage than a year ago, produced by a crop smaller than previously counted.
Those two facts reconcile in only one way. Somebody used about 230 million bushels less corn than USDA’s balance sheets assumed — and feed and residual is where that shortfall lives. That is the finding worth carrying into October 9, because it is the line USDA may have to cut.
September 1 stocks, all three crops
| Million bushels | Sept 1, 2026 | Sept 1, 2025 | Change |
|---|---|---|---|
| CORN | |||
| On-farm | 787.3 | 643.2 | +22.4% |
| Off-farm | 1,307.8 | 908.1 | +44.0% |
| Total corn | 2,095.1 | 1,551.3 | +35.1% |
| SOYBEANS | |||
| On-farm | 90.4 | 91.5 | −1.2% |
| Off-farm | 224.7 | 233.3 | −3.7% |
| Total soybeans | 315.1 | 324.8 | −3.0% |
| ALL WHEAT | |||
| On-farm | 546.5 | 692.2 | −21.1% |
| Off-farm | 1,299.2 | 1,441.8 | −9.9% |
| Total wheat | 1,845.7 | 2,134.0 | −13.5% |
USDA NASS Grain Stocks, September 30, 2026. Percentages are our calculations from the published figures.
Against what the trade expected
Three surveys published pre-report estimates and they did not agree, so the size of the corn surprise depends on which one you use. All three were well short.
| Survey | Corn estimate | USDA actual | Surprise |
|---|---|---|---|
| Dow Jones / WSJ (range 1,860–2,005) | 1,924 | 2,095 | +171 |
| Reuters | 1,918 | 2,095 | +177 |
| Bloomberg | 1,911 | 2,095 | +184 |
The number came in above the highest estimate in the Dow Jones range. Not above the average — above the top of the range, 2,095 against a high guess of 2,005. Nobody surveyed had it.
The other two crops went the other way. Soybeans at 315 million came in roughly 8 million under the Dow Jones average of 323 and 9 under the Reuters figure of 324. All-wheat at 1,846 million landed about 3 million under the Dow Jones average of 1,849 — close enough to call in line — and 26 under Reuters.
That contrast matters for how you read the day. A grain-wide bearish stocks report and a corn-only one are different situations, and this was the second.
Where 230 million bushels went missing
USDA’s September WASDE carried 2026/27 corn beginning stocks at 1.922 billion bushels. The actual September 1 count was 2.095 billion — 173 million higher. In the same release, NASS cut 2025 corn production by 57 million bushels.
| Supply was smaller than the balance sheet assumed | −57 mil bu |
| Ending stocks were larger than the balance sheet assumed | +173 mil bu |
| So use must have been smaller by | 230 mil bu |
There is nowhere else for it to go. Exports and ethanol are measured and reported through the year; feed and residual is the line that absorbs the difference, and USDA re-estimates it when a stocks count disagrees with its balance sheet.
In our opinion, that is the single most important thing in this report for anyone holding unpriced corn. A one-off inventory surprise is a fact about September 1. A 230-million-bushel overstatement of feed demand is a fact about the whole year ahead, and USDA decides what to do about it on October 9.
What the board did
| Contract | Sept 29 | Sept 30 | Change |
|---|---|---|---|
| December corn | $5.22 | $5.00¾ | −21¼¢ |
| November soybeans | $12.97¾ | $12.93 | −4¾¢ |
| December Chicago wheat | $6.92¾ | $6.75¾ | −17¢ |
Settlements as reported by USDA Agricultural Marketing Service. A separate Dow Jones report described December corn finishing at $5.01¼ — half a cent from the AMS settlement. We show the settlement and note the difference rather than picking one, and you should verify against your own quote provider before acting.
Corn took the hit, which fits a corn-specific surprise. Wheat fell 17 cents despite stocks coming in near expectations and 13.5% below a year ago — a reminder that these markets trade together on a report morning whether or not their own numbers justify it.
The Small Grains Summary: final 2026 wheat by class
Released the same morning and easy to overlook. This is the final production count for the 2026 wheat crop, and it matters to you by class rather than in aggregate.
| Class | Final production | Against the August estimate |
|---|---|---|
| Hard red winter | 466.4 mil bu | About 463 million — up slightly |
| Soft red winter | 293.8 mil bu | About 287 million — up slightly |
| Hard red spring | 416.3 mil bu | No matching August figure published |
| White, four classes | 292.4 mil bu | No matching August definition |
| Durum | 64.8 mil bu | About 66 million — down slightly |
| All wheat | 1,533.7 mil bu | 31.9 million acres at 48.1 bushels |
One trap worth naming. USDA also publishes an “all other spring” figure of 449.6 million bushels. That is not hard red spring — it is hard red spring plus hard white spring plus soft white spring. If you price hard red spring, the number you want is 416.3 million, and substituting the larger one overstates your class by 33 million bushels.
Durum was the one class published with full detail: 1.634 million harvested acres at 39.7 bushels. The table we worked from did not publish harvested acres and yields by class for the others.
Where the corn actually is
A national number does not set your bid. These do. The split between commercial and on-farm matters because they create different problems for you.
| State | On-farm 2026 | Change | Off-farm 2026 | Change |
|---|---|---|---|---|
| Illinois | 58.0 | +3.6% | 194.9 | +78.0% |
| Minnesota | 105.0 | +9.4% | 137.3 | +70.7% |
| North Dakota | 33.0 | +26.9% | 49.9 | +68.1% |
| Nebraska | 105.0 | +50.0% | 143.1 | +49.3% |
| Kansas | 21.0 | +156.1% | 68.3 | +71.9% |
| South Dakota | 85.0 | +46.6% | 73.8 | +28.0% |
| Ohio | 32.0 | +39.1% | 52.8 | +33.9% |
| Iowa | 140.0 | +7.7% | 275.5 | +32.3% |
| Indiana | 39.0 | +11.4% | 48.3 | −0.4% |
Million bushels. Percentages are our calculations from the published state figures.
The next three dates
Frequently asked questions
What is the December to March corn carry on September 30, 2026?
December 2026 corn settled at $5.00¾ and March 2027 at $5.15½, a carry of 14¾ cents per bushel. May 2027 settled at $5.23¼, adding another 7¾ cents over March. Commercial storage at 3 to 5 cents per month plus interest on roughly $4.60 cash corn costs about 17 to 23 cents over three months, so the December-to-March carry does not cover commercial storage without a basis improvement. On-farm storage with bins already paid for and variable costs near 4 cents runs about 12 cents, which the carry does cover.
What does the September 1 reference date mean in the Grain Stocks report?
It is the date the inventory was counted, not the date the report was published. The September 30 release reports what was physically in storage on September 1, 2026. USDA counts the major grains four times a year — March 1, June 1, September 1 and December 1 — and publishes a few weeks later, with the December count normally released the following January. September 1 is also the end of the old-crop marketing year for corn and soybeans, which is why this count becomes the 2026/27 beginning stocks figure.
How much corn was in storage on September 1, 2026?
USDA counted 2.095 billion bushels, split between 787.3 million on farms and 1,307.8 million in off-farm commercial storage. That is up 35.1% from 1.551 billion a year earlier, and above every pre-report survey average — Dow Jones at 1,924 million, Reuters at 1,918 million and Bloomberg at 1,911 million.
Why were corn stocks higher if the 2025 crop was revised smaller?
Because less corn was used than USDA’s balance sheets assumed. Production was cut 57 million bushels while ending stocks came in 173 million above the September WASDE figure, which means 2025/26 disappearance fell roughly 230 million bushels short. Feed and residual is the line that absorbs that difference, and it is the line USDA may revise on October 9.
Did soybean and wheat stocks also come in high?
No. Soybean stocks fell 3.0% from a year ago to 315.1 million bushels, roughly 8 million under the Dow Jones survey average. All-wheat stocks fell 13.5% to 1,845.7 million, about 3 million under the Dow Jones average and essentially in line. This was a corn-specific surprise rather than a grain-wide one.
Does it pay to store corn from December to March?
The December-to-March carry settled at 14¾ cents on September 30. Commercial storage at 3 to 5 cents per month plus interest costs roughly 17 to 23 cents over three months, so the carry does not cover it without a basis improvement. On-farm storage with bins already paid for and variable costs near 4 cents runs about 12 cents, which the carry does cover. Use your own storage and drying costs rather than these illustrative figures.
Which states have the most corn in commercial storage?
Illinois off-farm stocks rose 78.0% to 194.9 million bushels, Minnesota 70.7% to 137.3 million, North Dakota 68.1% to 49.9 million, and Iowa 32.3% to 275.5 million. On the farm side, Kansas more than doubled at plus 156.1%, Nebraska rose 50.0%, South Dakota 46.6%, and Ohio 39.1%. Commercial congestion and on-farm overhang create different basis pressures.
How much does corn basis typically weaken at harvest?
A University of Illinois study covering 136 elevators in 12 states from 2010 to 2025 found corn basis averages about 11 cents per bushel weaker at harvest than in late November. That historical average is a useful benchmark against your storage cost, though your own elevator’s record is the better guide.
What was the final 2026 wheat production by class?
The Small Grains Annual Summary put hard red winter at 466.4 million bushels, soft red winter at 293.8 million, hard red spring at 416.3 million, the four white classes combined at 292.4 million and durum at 64.8 million — 1,533.7 million bushels of all wheat from 31.9 million acres at 48.1 bushels per acre. Note that USDA’s separate “all other spring” figure of 449.6 million includes hard red spring plus the spring white classes and should not be substituted for hard red spring alone.
Whether storage pays depends on your actual drying and handling costs, your local basis history, and what you still have unpriced. Those are specific to your farm, and the next USDA release is nine days out.
Have your expected production, what is already sold, your storage capacity and your delivery commitments handy, and call us at (800) 944-3850. If the answer is that an elevator contract fits your operation better than anything on the board, we will say so.
Sources
- USDA NASS Quarterly Grain Stocks, September 30, 2026 — national and state stocks figures. esmis.nal.usda.gov
- USDA NASS Small Grains Annual Summary, September 30, 2026 — final 2026 wheat production by class. esmis.nal.usda.gov
- USDA NASS Executive Briefing, September 30, 2026 — 2025 production revisions. nass.usda.gov
- Price Group, September 29, 2026 — Dow Jones / Wall Street Journal pre-report survey averages and ranges. blog.pricegroup.com
- ADM Investor Services, September 30, 2026 — Reuters survey averages. admisi.com
- USDA AMS daily grain reports, September 29 and 30, 2026 — CBOT settlements. ams.usda.gov
- USDA NASS Crop Progress, September 28, 2026 — harvest pace as of September 27. esmis.nal.usda.gov
- DTN Wednesday Morning Basis Comments, September 30, 2026 — national average basis figures. dtnpf.com
- University of Illinois farmdoc daily, September 17, 2026 — “Under Pressure: The Size and Timing of the Harvest Low in Corn Basis,” 136 elevators across 12 states, 2010–2025. farmdocdaily.illinois.edu
Methodology: Stock figures are as published by USDA NASS. Percentage changes, the implied 230-million-bushel use shortfall, and the carry and storage-cost comparisons are Ag Optimus calculations from published inputs and are labeled as such — they are not USDA estimates. Futures prices are settlements as reported by USDA Agricultural Marketing Service and were not independently verified against exchange records; a separate Dow Jones report described December corn finishing at $5.01¼ against the $5.00¾ AMS settlement, and we show the settlement. Verify all price levels against your own quote provider. Storage-cost figures are illustrative; use your own interest rate, drying and handling costs.
Disclosure: This material is for general educational and informational purposes only. It is the opinion of Ag Optimus where marked, and it is not a recommendation to buy or sell any futures contract, option, cash contract or other financial product, nor individualized marketing, hedging, tax or legal advice. Trading futures, options and swaps involves substantial risk of loss and is not suitable for all investors; losses can exceed funds deposited. Past performance is not necessarily indicative of future results. USDA does not endorse, certify or approve this analysis, Ag Optimus, or Optimus Futures LLC, and the use of USDA data here does not imply any such endorsement. Optimus Futures does not maintain a research department as defined in CFTC Rule 1.71. Ag Optimus is a registered DBA of Optimus Futures LLC [NFA ID 0481133]. All marketing and trading decisions remain yours.
