
|
Corn good/excellent
57%
0 points
|
Soybean good/excellent
58%
−2 points
|
Corn dented
62%
+17 points
|
Executive summary
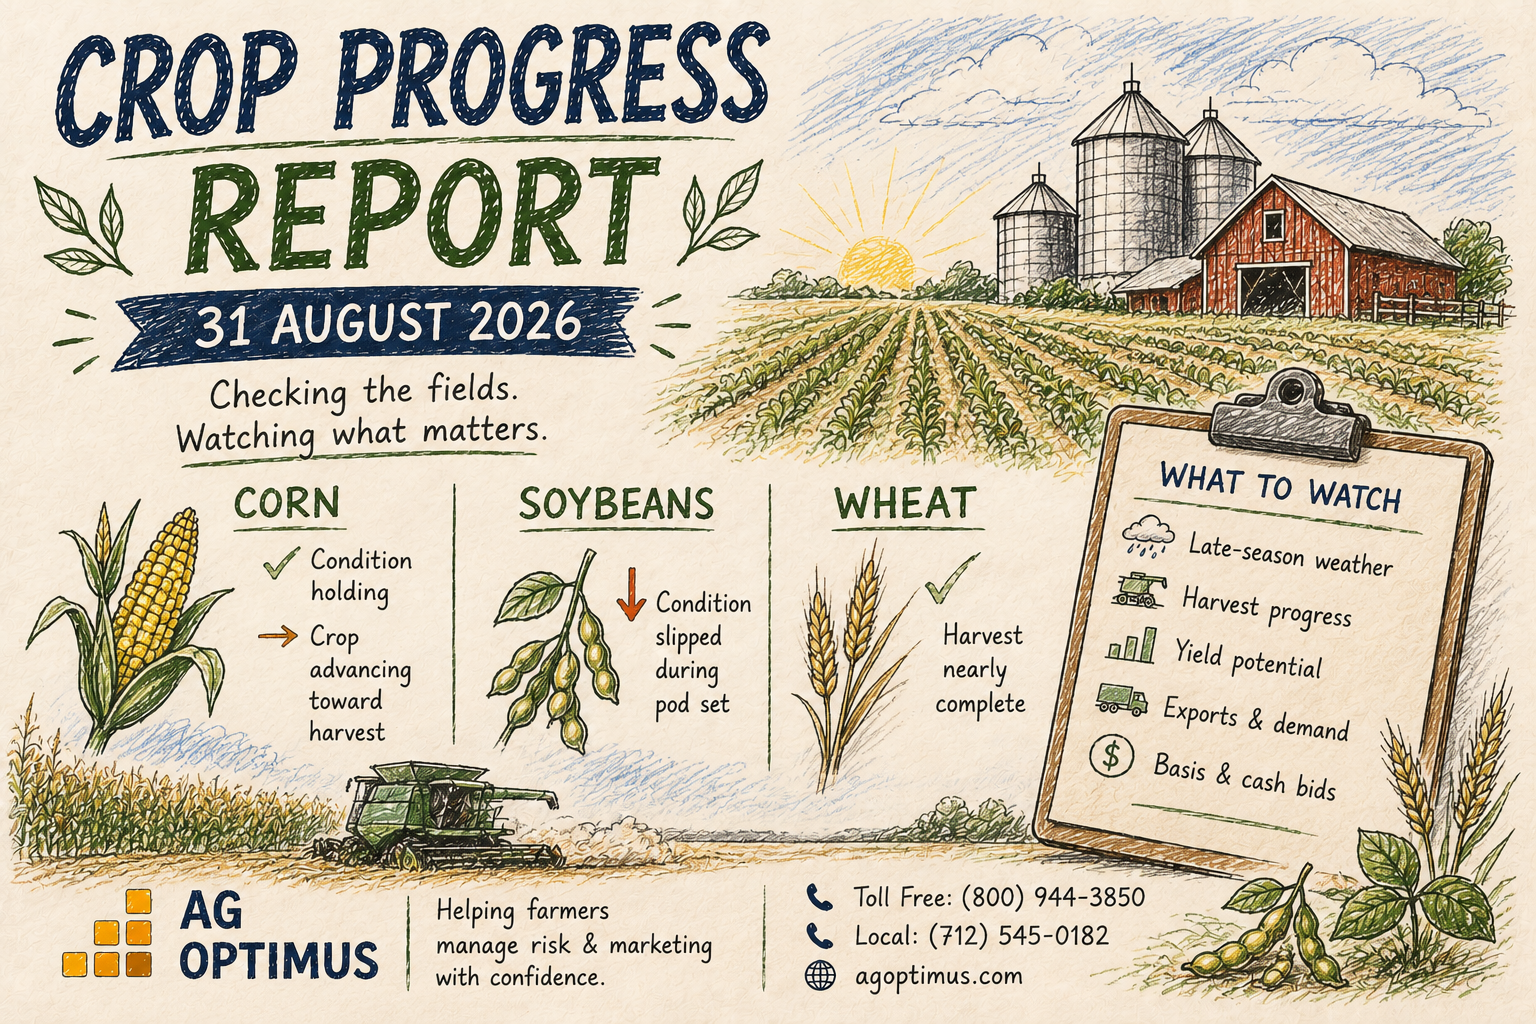
USDA did not give corn traders a new shock Monday. It did give soybean traders a reason to pay closer attention. Corn held at 57% good/excellent—the lowest rating of the season and 12 points below the comparable late-August reading last year—while soybeans slipped another 2 points to 58% during late pod set and seed fill.
The timing is now the key issue. Corn was 62% dented and 13% mature; soybeans were 95% setting pods and 13% dropping leaves. The market is rapidly moving beyond the point at which a weekly rating alone can settle the yield debate. The next evidence will come from combine monitors, grain moisture, test weight, delivered bushels, local basis, and early harvest reports.
The report does not establish a guaranteed futures-price outcome. It does strengthen the case for closely updating farm-level yield expectations, storage plans, cash offers, and basis targets as harvest results begin to replace condition ratings as the market’s primary evidence.
Headline scorecard
Aug. 30, 2026 vs. Aug. 23, 2026, with the comparable 2025 period and five-year average where USDA publishes one.
|
Aug. 30
57%
|
Aug. 23
57%
|
Delta
0 points
|
2025
69%
|
17%
|
Aug. 30
92%
|
Aug. 23
86%
|
Delta
+6
|
2025 / five-year
89% / 89%
|
|
Aug. 30
62%
|
Aug. 23
45%
|
Delta
+17
|
2025 / five-year
56% / 56%
|
|
Aug. 30
13%
|
Aug. 23
6%
|
Delta
+7
|
2025 / five-year
14% / 13%
|
|
Aug. 30
58%
|
Aug. 23
60%
|
Delta
−2 points
|
2025
65%
|
13%
|
Aug. 30
95%
|
Aug. 23
91%
|
Delta
+4
|
2025 / five-year
93% / 93%
|
|
Aug. 30
13%
|
Aug. 23
6%
|
Delta
+7
|
2025 / five-year
10% / 9%
|
77%
| Five-year average 68% |
USDA reported the national condition and progress figures in its August 31 release. Contemporaneous report coverage confirmed that corn held at 57% good/excellent while soybean good/excellent declined to 58% from 60% a week earlier.
What this means on the farm
Corn: Stable does not mean recovered
Corn’s 57% good/excellent rating did not deteriorate for a second week, but it also did not improve. The crop remains at the lowest rating of the season and well below the 69% good/excellent reading in the comparable late-August week last year.
For corn producers, the practical shift is timing. With 62% dented and 13% mature, a weekly condition rating will soon be less informative than actual field evidence. Watch early yield-monitor results against farm expectations, delivered moisture, standability, test weight, storage capacity, and nearby basis. A national rating that is lower than last year can support concern about yield potential, but it does not guarantee that a particular farm, county, or elevator market will experience the same outcome.
Soybeans: The new issue is the direction of change
Soybeans provided the report’s fresh development. National good/excellent conditions declined 2 points to 58%, 7 points below the comparable late-August 2025 reading of 65%.
The timing makes that change more relevant. USDA reported 95% of the soybean crop setting pods and 13% dropping leaves. Late weather, disease pressure, and seed-fill conditions can still influence final bushels, but the crop has less time for a widespread improvement before maturity advances further.
For soybean producers, the useful question is not whether a two-point decline automatically means prices must rise. It is whether local field conditions, pod counts, seed size, moisture prospects, and early harvest observations validate the national deterioration signal. The next USDA update will show whether Aug. 31 was a one-week interruption or the beginning of a continuing late-season decline.
Basis, logistics, and local supply
National ratings are not local yield reports. Iowa, for example, reported corn at 77% good/excellent in its August 31 state update, far above the 57% national figure; it also reported soybeans at 77% good/excellent. That contrast reminds us that local crop size, harvest pace, elevator space, and regional transportation capacity can move basis differently from the national futures narrative.
In practical terms, producers should separate two decisions:
|
Production management
Update expected bushels, moisture, drying needs, storage requirements, and cash-flow plans from actual local evidence.
|
Marketing management
Monitor futures, local basis, carry, bid windows, and offer levels. Use the national condition trend as context, not as a substitute for a farm-specific price and production plan.
|
Audit: what changed and what did not
Corn: detailed audit
The delta
- Weekly: 57% good/excellent on Aug. 30 versus 57% on Aug. 23 = 0-point change.
- Year over year: 57% in 2026 versus 69% in the comparable late-August 2025 period = −12 points.
- Condition distribution: 17% of the crop was rated poor or very poor.
Market interpretation
Corn did not add a new weekly bullish condition surprise, because the national rating did not decline. However, the report also offered no evidence of late-season recovery. The larger comparison remains the 12-point year-over-year condition deficit.
At this crop stage, the risk shifts. A crop can retain a weak condition profile but produce better or worse than implied depending on field-level rainfall, disease, standability, kernel depth, test weight, and the distribution of production across states. That is why early harvest reports deserve more attention now than a small weekly national rating move.
Soybeans: detailed audit
The delta
- Weekly: 58% good/excellent on Aug. 30 versus 60% on Aug. 23 = −2 points.
- Year over year: 58% in 2026 versus 65% in the comparable late-August 2025 period = −7 points.
- Condition distribution: 13% of the crop was rated poor or very poor.
Market interpretation
Soybeans were the new fundamental item in this report. The two-point decline is not, by itself, proof of a final yield reduction. Its relevance comes from when it occurred: 95% of the crop was setting pods, and leaf drop was already ahead of normal. Late seed-fill weather remains important, but time available for broad crop recovery is limited.
That makes the next condition report especially useful. Another decline would establish a multiweek late-season deterioration pattern. Stabilization or improvement would suggest the Aug. 31 reading was not necessarily the start of a larger national trend.
To make the full condition distribution easier to compare, Ag Optimus calculates a Condition Balance:
|
Corn
Good/excellent 57%
Poor/very poor 17%
+40
points
|
Soybeans
Good/excellent 58%
Poor/very poor 13%
+45
points
|
This is an Ag Optimus calculation—not a USDA index, yield forecast, or trading signal. It adds context that the good/excellent headline by itself omits. Corn and soybeans have similar good/excellent ratings, but corn’s 17% poor/very poor share is larger than soybeans’ 13% share.
Development and risk clock
The transition is important. Weekly ratings remain useful, but the closer a crop gets to harvest, the more physical evidence matters—yield monitors, elevator receipts, quality data, and local supply flow.
What to watch next
- The September 7 Crop Progress report: A further soybean decline would extend the late-season deterioration pattern. A meaningful corn improvement would be needed to change the broader weak-condition narrative.
- Early harvest results: Compare actual yield, moisture, test weight, grain quality, and basis with expectations built from USDA’s August production outlook.
- Local basis and logistics: Strong or weak crops in major nearby production areas can affect elevator space, delivery windows, drying needs, storage decisions, and cash bids differently from national futures.
- USDA September production and WASDE reports: The next monthly production update will test whether USDA adjusts yield assumptions as it incorporates late-season conditions and objective field information.
- Export demand: Weekly export sales and pace of shipment remain critical for determining whether tighter production expectations are met by enough demand to support prices.
- Wheat’s global drivers: As U.S. spring-wheat harvest advances, export competition, Black Sea shipping conditions, Russian and Ukrainian export policy, and global tenders become relatively more important.
Bottom line
The August 31 report had a simple but useful hierarchy. Corn confirmed a weak condition baseline; soybeans introduced the fresh deterioration; crop development is rapidly shifting the market toward harvest-time proof.
For farmers, that means the highest-value information is increasingly local: combine results, moisture, quality, storage availability, basis, and cash bids. The national report is a valuable benchmark, but it should inform—not replace—a farm-specific production and marketing plan.
Common questions about the August 31 Crop Progress report
What did USDA report for corn condition on August 31, 2026?
Corn held at 57% good/excellent—the lowest rating of the season and 12 points below the comparable late-August reading last year. The rating was unchanged from 57% on Aug. 23, and 17% of the crop was rated poor or very poor.
Why did soybeans matter more than corn in this report?
Soybeans provided the report’s fresh development. National good/excellent conditions declined 2 points to 58%, 7 points below the comparable late-August 2025 reading of 65%. The timing increases the relevance of that change: 95% of the crop was setting pods and 13% dropping leaves, so the crop has less time for a widespread improvement before maturity advances further.
What is the Ag Optimus Condition Balance?
Condition Balance = (Good + Excellent) − (Poor + Very Poor). Corn scores +40 points and soybeans +45 points. This is an Ag Optimus calculation—not a USDA index, yield forecast, or trading signal. It adds context that the good/excellent headline by itself omits. Corn and soybeans have similar good/excellent ratings, but corn’s 17% poor/very poor share is larger than soybeans’ 13% share.
How far along are corn and soybeans?
Corn was 92% dough, 62% dented, and 13% mature. Soybeans were 95% setting pods and 13% dropping leaves. Spring wheat was 77% harvested, 9 points ahead of normal. Major progress indicators are near to ahead of normal, so early harvest results will arrive soon and may replace ratings as the central price input.
Why did Iowa report much better conditions than the national number?
National ratings are not local yield reports. Iowa reported corn at 77% good/excellent in its August 31 state update, far above the 57% national figure; it also reported soybeans at 77% good/excellent. That contrast reminds us that local crop size, harvest pace, elevator space, and regional transportation capacity can move basis differently from the national futures narrative.
Does this report mean grain prices will rise?
The report does not establish a guaranteed futures-price outcome. It does strengthen the case for closely updating farm-level yield expectations, storage plans, cash offers, and basis targets as harvest results begin to replace condition ratings as the market’s primary evidence.
Sources of reference
- USDA National Agricultural Statistics Service (NASS), Crop Progress, released Aug. 31, 2026. Official national crop-condition and development report covering the week ending Aug. 30, 2026. USDA release PDF
- DTN, “USDA Crop Progress: Corn Rated 57% Good to Excellent,” Aug. 31, 2026. National corn and soybean good/excellent ratings, weekly changes, and development progress. DTN report
- Brownfield Ag News, “57% of U.S. corn, 58% of soybeans good to excellent,” Aug. 31, 2026. Independent contemporaneous summary of the national condition update and progress details. Brownfield report
- Agriculture.com, “Corn Condition Remains at Season Low as 13% of Crop …,” Aug. 31, 2026. Context on corn’s seasonal-low condition rating and crop maturity. Agriculture.com report
- Iowa Department of Agriculture and Land Stewardship, Iowa Crop Progress and Condition Report, Aug. 31, 2026. State-level crop-condition context. Iowa report
- USDA NASS, Charts and Maps—Crop Progress and Condition. USDA crop-progress charts, timetables, and related historical context. USDA charts and maps
Methodology: “Weekly delta” equals the Aug. 30, 2026 reading minus the Aug. 23, 2026 reading. “Comparable 2025 period” refers to the corresponding late-August 2025 reporting period. Five-year averages are shown only when USDA publishes a relevant progress benchmark. The Ag Optimus Condition Balance equals good/excellent minus poor/very poor. It is not a USDA measure, production estimate, price forecast, or recommendation.
Disclosure: This material is provided for educational and informational purposes only. Futures and options involve substantial risk and are not suitable for every producer or investor. Past performance is not necessarily indicative of future results.
USDA does not endorse, certify, or approve this analysis, Ag Optimus, or Optimus Futures LLC, and the use of USDA data here does not imply any such endorsement. Optimus Futures does not maintain a research department as defined in CFTC Rule 1.71. Ag Optimus is a registered DBA of Optimus Futures LLC [NFA ID 0481133]. All trading decisions remain yours.
