
David Ericson is a registered broker and branch office manager with AgOptimus, raised on a farm near Akron, Iowa, where he continues to help raise corn, soybeans, and cattle today. Registered since 2015, David also appears on TV on behalf of AgOptimus on KTIV in Sioux City, and is heard on 570 AM, Rural Radio, and the American Ag Network.
This article is the opinion of Optimus Futures
Cattle Feeders: Use These Market Reports to Improve Margins
A cattle feeder does not need more noise — just a short list of market reports that explain the cost to place feeders, the market value of finished cattle, the cost of feed, and the timing of supply. No report guarantees a profitable placement. But in a business where margins turn on cattle prices, corn prices, interest expense, and how the animals actually perform, better information makes for better decisions.
Why margins matter more than headline prices
When cattle prices are high, that does not automatically translate into attractive feeding margins. A feeder can still face pressure with replacement cattle running expensive, feed costs rising, interest rates holding firm, or cattle failing to perform in the yard. Research summarized by the Iowa Beef Center shows that a large share of the variation in cattle feeding margins comes from feeder cattle prices and corn prices, so the margin story is rarely as simple as whether the board is up or down.
For a cattle feeder, the useful question these market reports answer is not where cattle prices are today. It is whether incoming feeder cost, feed cost, and market-ready supplies line up well enough to support a workable margin — and that takes reports covering both sides of the equation.
Key Takeaways for Managing Feeding Margins
- Supply Timing: The USDA Cattle on Feed report provides critical data on feedlot placements, which could potentially help feeders project when future fed cattle supplies will reach the market.
- Input Cost Management: Feeder cattle prices and corn prices drive the majority of feeding margin variation. Tracking USDA AMS feeder reports and grain markets is essential before placing cattle.
- Actionable Data: Margin trackers and calculators combine disconnected data (feeder costs, fed cattle values, and feed expenses) into estimated breakevens, turning raw reports into a structured decision framework.
Start with Cattle on Feed
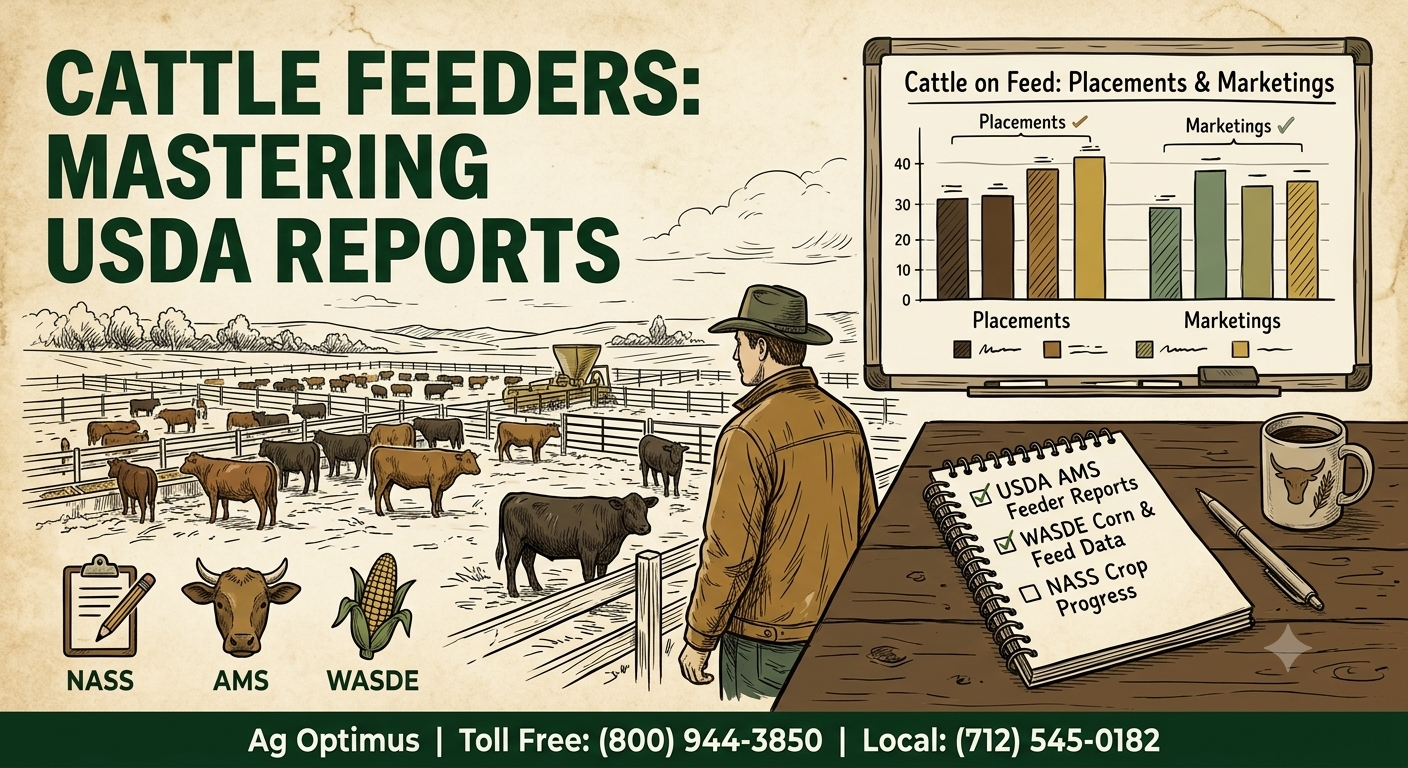
The USDA Cattle on Feed report is the first of the market reports a cattle feeder should never skip. Published monthly, it lays out current feedlot inventory, placements, marketings, and other disappearance. The headline number matters, but experienced market participants read the placements line first — especially placements by weight class — because that line tells you when future fed cattle supplies will arrive.
Watch feeder cattle reports before buying replacements
USDA AMS feeder and replacement cattle reports are crucial because the feeder purchase is the biggest check most yards write; they provide national summaries, state auction results, and direct price data by weight class, region, and market tone.
Their value is practical: they show how your local market compares with the broader region, whether certain weight classes are running unusually expensive, and whether buying interest is strengthening or fading.
Follow fed cattle cash trade and carcass data
Keep track of fed cattle cash trade and carcass data. The feeding margin only becomes real when the cattle sell, so watch regional direct trade, live versus dressed pricing, and carcass quality to see what the market is rewarding right now.
Keep grain and feed reports in the picture
Cattle feeders are also corn buyers. USDA crop reports, WASDE updates, local grain bids, and basic corn futures and basis information matter because feed costs drive cost of gain, and cost of gain determines whether the margin survives.
The Iowa Beef Center notes that feeder cattle prices and corn prices explain a meaningful portion of variation in cattle feeding margins. For feedlots, grain reports are essential inputs to margin management, not background noise.
Use margin trackers to connect the pieces
Most feeders have no interest in interpreting every raw report from scratch. This is where margin trackers come in: they integrate feeder prices, fed cattle values, feed costs, and sometimes carcass assumptions into a single estimated margin view.
For instance, if an 800-pound feeder steer is purchased for $240 per cwt ($1,920 total) and the projected feed cost of gain is $1.15 per pound to reach a 1,400-pound market weight, the raw break-even cost on the finished animal—before accounting for interest, yardage, or freight—sits around $185 per cwt.
The Whole Routine on One Page
| Report | What to watch for | What to do with it | What to tell your commodity broker at Ag Optimus |
|---|---|---|---|
| USDA Cattle on Feed Monthly |
Placements versus expectations — especially by weight class — plus marketings and total on-feed. | Map when future fed supplies will reach the market; review placement timing and hedge triggers. | Your placement schedule and the months you will have cattle to price — and discuss whether hedge coverage for those months should be started, added to, or left alone. |
| USDA AMS feeder & replacement reports Weekly — review before buying |
Compare prices by weight class and region, and note whether buying interest is strengthening or fading relative to your local market. | Before bidding, compare replacement cost to breakeven; the margin is set the day cattle enter the yard. | The weights and regions you are bidding on — and ask whether coverage on the buy side of replacements, such as feeder futures or calls, fits your situation before you bid. |
| Fed cattle cash trade & carcass data Weekly |
Regional cash tone, live vs. dressed pricing, quality premiums, and whether weights are getting burdensome. | Set the marketing posture: more active when cash supports it, patient when it does not. | Your marketing window and breakeven — and discuss where sell stops or target sell orders belong under that window. |
| Grain reports, WASDE & local bids Weekly and on major report days |
Corn futures direction, local basis, and anything that shifts the ration cost. | Update cost-of-gain assumptions and re-run breakevens — never leave feed cost on autopilot. | Your ration and corn needs — and discuss corn coverage for the feeding months: futures, calls, or cash-side tools through your elevator. |
| Margin trackers & calculators Monthly and at placement |
Estimated breakeven and closeout given current feeder cost, feed cost, and fed values. | Sanity-check a placement before committing, and bring the numbers to any risk-management conversation. | Your estimated closeout — and when the tracker shows a workable margin, ask how you would hedge both sides: the feeder-and-corn cost side and the fed-cattle sale side. |
How Often a Cattle Feeder Should Check These Market Reports
Some reports need more frequent review than others. Track feeder cattle prices, cash tone in fed cattle, and grain prices through the week, then review Cattle on Feed and the margin tools monthly — that keeps you informed without making market-watching a second job.
What matters more than frequency is consistency. Nobody needs to read every line of every report — but the feeder who checks the same core reports on a steady schedule spots supply changes and rising feed costs before they hit the margin.
What the reports are really for
None of these cattle market reports promises a feeder a profit or tells you what to do. Their value shows up in subtler returns: better decisions in a business sensitive to small margins, where timing, cost control, and honest assumptions decide outcomes. A feeder who understands placements, replacement costs, fed cash trade, and feed-cost pressure is simply in a better spot than someone reacting to a headline.
Better information doesn’t make cattle feeding risk-free. What it buys is more thoughtful placements, more honest margin benchmarks, and clearer market-based actions than any headline ever will.
Reading the reports is half the job. Talking them through is the other half. Our brokers work with cattle feeders on exactly this: connecting placements, replacement costs, feed coverage, and marketing windows to a risk-management plan that fits the yard.
Call us toll-free at (800) 944-3850 or locally at (712) 545-0182 to speak with an Ag Optimus broker.
Frequently Asked Questions
Which cattle report matters most to a feeder?
If you can only watch one report closely each month, start with USDA Cattle on Feed: placements, marketings, and on-feed totals provide the strongest insight into future fed cattle supplies. Use it alongside feeder cattle reports and your feed-cost numbers rather than on its own.
How often should a cattle feeder check market reports?
Track feeder cattle prices, cash tone in fed cattle, and grain markets through the week, then step back monthly for Cattle on Feed and the margin tools. The goal isn’t constant screen time — it’s consistent awareness of the changes that move breakevens and marketing decisions.
Do small and mid-sized cattle feeders really use these reports?
Yes — many small and mid-sized feeders do, though they don’t always use the USDA PDFs directly. Smaller operations often rely on commodity brokers, extension specialists, consultants, or private margin tools that interpret the same core USDA and cash-market data.
Can market reports tell a producer when to place cattle?
Market reports can help you make better placement decisions, but they can’t make the decision for you or promise a specific outcome. They show how feeder cost, fed cattle price, feed cost, and supply timing relate at a given moment.
Disclosure
This material is general educational content from Ag Optimus. References to USDA and other third-party reports are for informational purposes only; Ag Optimus is not affiliated with, and does not control the content of, those sources, and data may be revised after publication. The break-even example shown is hypothetical, uses simplified assumptions, and excludes costs such as interest, yardage, freight, death loss, and basis; actual results will differ by operation. No report, tool, or framework removes price risk or guarantees a profitable placement or marketing outcome. Trading futures and options involves substantial risk of loss and is not suitable for all investors; you may lose more than your initial deposit. Past performance is not necessarily indicative of future results. Every operation is different; evaluate any decision against your own production costs, marketing plan, financial situation, and risk tolerance, and consult your commodity broker regarding suitability.
