It is report day and traders do not expect to see many changes in the numbers, particularly where yields are concerned. The report will factor in the slightly higher acreage data from June 30, and will be released at 11:00 central time. Look for light position-evening to continue into the data. Traders will be looking at how much USDA will lower Brazil’s Safrinha corn crop, and what they will be doing with demand numbers. As a reminder, Brazil’s Conab was at 93.4 mmt, with the USDA at 98.5 mmt in June. Most private estimates are more in the mindset that the freeze nipped potential back to the 85-90 mmt range for the Safrinha crop.
There have been rumors that China has been looking at both beans and corn on this break. Three South Korean groups are issuing separate corn tenders today. Beans and corn also see support from calls for hotter and drier weather this week moving forward. Beans/corn are called higher, soyoil and oilshare are upside leaders, and meal / wheat prices are mixed to lower.
In politics, Argentine grain farmers and cattle ranchers protested Friday in the town of San Nicolas in BA province to protest about export taxes and limits placed on beef shipments that critics say are bad for investment in the farm sector. Thousands of farmers were in tractors and trucks for the roadside demonstrations, which was organized by the rural association CARBAP, to coincide with Argentina’s Independence Day holiday.
WEATHER – The weekend was wet and cool in the Midwest, staying hot in the far western cornbelt. Rainfall remains below average in Minn., Wisconsin, parts of Iowa, parts of northeastern Illinois, southern Michigan and the Dakotas. Weather was wet across the Delta and the southeastern states along with western North Dakota and parts of Montana. Eastern Neb. had good rainfall, up to 3″ with 3-4″ in western Illinois. US weather over the next 10 days will bring rains to most of the Midwest and Delta, while the far west has a new heat wave building. Michigan benefited from recent rainfall, perhaps eliminating the D1-D2 drought levels on the Drought Monitor since late June.
Drought issues remain in the northwest quadrant of the belt which may make it difficult to make trendline yields. North Dakota and Kansas were the only locations not to receive rains over the last week. Crop conditions still continue to decline across the Dakotas and Minnesota. Corn and beans are getting closer to reproductive phases in this area.
REPORTS
Commitment-of-traders report disaggregated futures / options combined as of July 1:
beans: net long 92,180
meal: net long 20,964
soyoil: net long 48,174
corn: net long 219,371
wheat: net short 13,617
Given all the selling last week, positions were expected to be reduced. However, new shorts are also part of the make-up of the corn market as well.
ANNOUNCEMENTS
Cordonnier lowered Paraguay’s corn crop forecast to 3.0 mln mt, down 1.2 mln mt from mo ago, impacted by drought and freeze. Paraguay had been exporting corn to Brazil, but now there may not be enough supply to meet those export contracts.
Russia’s Ag Ministry is considering setting the grain reserve floor of 3.0 mln mt for the 22/23 crop year, whereas the ministry has prev. said they would start grain purchases for state reserves in 2022.
China will add 10.85 mln tonnes of storage capacity to its already massive grains stockpiling program, official media reports. Singrain, the country’s state stockpiler, will begin to build 120 storage facility projects located in 18 provincial administrations this year, reported huanqui.com, the website under the Global Times.
DELIVERIES
meal: 307 JP Morgan put out 307
KC wheat: 39
Calls are as follows:
beans: 2-4 higher
meal: 1.20-1.30 lower
soyoil: 45-60 pts higher
corn: 2-2 1/2 higher
wheat: mixed/lower
Outside markets feature lower crude trading down to $73.16/barrel, as the G20 says that the coronavirus variants could threaten growth potential and demand. The Dow is down 107 pts, while the US dollar is firmer to 92.42.
Tech talk: December corn prices match trading range lows at $5.14, a level that has to hold in order for prices to remain in current trading ranges. There seems to be good support for the morning here, as perhaps new shorts in corn, (as noted by the COT), creates a bit of a bounce from the lower $5.07 – $5.14 range. Prices are back over $5.20 and that is chart stabilizing. New shorts are looking for prices to move through $5.00 for a $4.80 target low, so the presence of new short positions is perhaps responsible for today’s opening bounce. December wheat continues its journey in its narrow down-trend channel, not quite touching the new low last week at $6.18. If prices move above $6.30 it will turn above the down-trend channel which will create more short-covering activity. Think we are looking to form a $6.15-$6.50 trading range in the big picture, and the lows from last week adjust the range down a bit. November bean prices remain resilient above $13.00, staying above the 100 day moving average at $13.11, and trading back towards highs of $13.50. The chart has a week of newly defined lows from last week as support which crosses at $13.08-$13.11, and would prefer to be long now against this level for possibly higher trade, and maybe a retracement up towards the gap from $13.73 – $13.82. December soyoil price action continues to remain in bull market territory, as prices last week created a new line of visual support to work against, trading to new recovery highs this AM at 6230c. This is a chart where pullbacks should be owned, as the pattern has been for big breaks to hold and eventually pave the way upward. First resistance is where prices are located, at 6230c, but above that there is nothing to stop a rally towards 64c-65c again. For the day, interim resistance is 6250c on another rally, and would continue to own 100-150 pt breaks if needing coverage. December meal chart direction is sideways/lower, and would note that trendline support for the day crosses at $355.00. The down-trend is neutral to strong as prices work lower, but if needing to price this chart has offered up $350.00-$355.00 as good support. The tendency is for prices to trend lower, and a break of $355.00 would break support and could wait for $350.00 in that case.
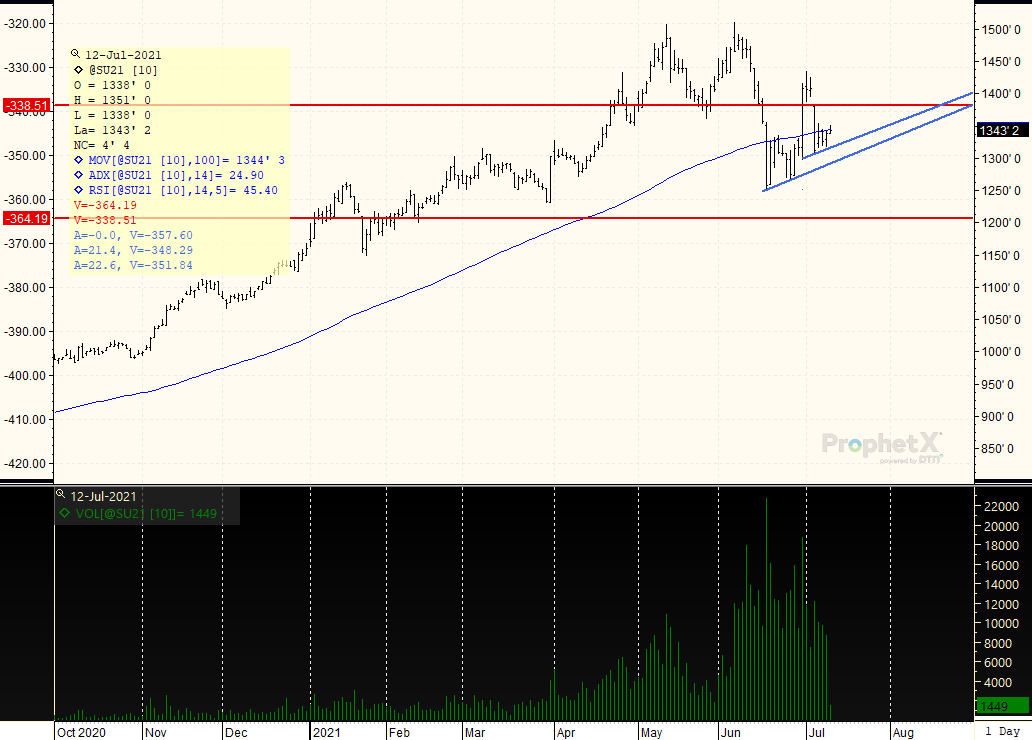
SEPTEMBER BEANS: Funds have pared back length, but the chart is sporting a slightly friendlier outlook as prices move back over the 100 day moving average at $13.44, but more importantly forming and holding trendline support as shown by the upper blue trendline on the chart. Would therefore look for prices to steadily have a chance to climb back towards the open gap above the market. Look for a trading range from the July 6 low of $13.08 to $13.50, or higher.
Receive Relevant and Timely Grain Market Reports that Matter!
Get updated twice a week with concise, direct information that you can use in grain trading, marketing, and farm management
Better yet, become a customer and get DAILY updates, fundamental, and technical, sent straight to your Inbox! Contact Us now to get started.
RISK DISCLAIMER: Trading in commodity interest products such as futures, options and otc swaps entails significant risks of loss which must be understood prior to trading and may not be appropriate for all investors. You should carefully consider whether trading is suitable for you in light of your circumstances, knowledge, and financial resources. You may lose all or more of your initial investment. Opinions, market data, and recommendations are subject to change at any time. The placement of contingent orders by you or broker, or trading advisor, such as a stop-lossor stop-limitorder, will not necessarily limit your losses to the intended amounts, since market conditions may make it impossible to execute such orders. Long options strategies could lose their entire premium plus transactional costs. Short options strategies entail unlimited risk of loss plus transactional costs. The information presented represents the opinion of Ag Optimus. Past performance of actual trades or strategies cited herein is not necessarily indicative of future performance. Futures prices factor in the seasonal aspects of supply and demand. This communication may cite historic data and should not be taken to mean certain trades can produce dramatic profits year in and year out. This information does not imply customers have or will experience profits based on seasonal trades or trade data. All information, communications, publications, and reports, including this specific material, used and distributed by Optimus Futures, LLC (“Optimus”) shall be construed as, or is in the nature of, a solicitation for entering into a derivatives transaction. Optimus does not distribute research reports, employ research analysts, or maintain a research department as defined in CFTC Regulation 1.71. This email may include information produced by third parties. Material not labelled Optimus Futures should be considered to be third-party, and is provided for informational purposes only. Third-party material is from sources believed to be reliable, but its accuracy is not guaranteed by Optimus Futures. Optimus Ag and Ag Optimus are registered dbas of Optimus Futures LLC [NFA ID 0481133] CONFIDENTIALITY NOTICE: Privileged/Confidential information may be contained in this message. If you are not the intended recipient, please notify the sender immediately and you must not use the message for any purpose nor disclose it to anyone. Communications on all mediums may be recorded.