The surprising strength of the rallies this week caught bears off guard, creating a short-covering rally which found little selling pressure. Corn was the strongest market, but makes sense since it was the most beaten up heading into the Sep. report. Basis remains strong. The hurricane, which triggered fund selling and liquidation, perhaps got the market to a point where it 1. had to come up for air and 2. created an undervalued condition for corn, in particular, given the amount of fund selling into the Sep. 10 data. Near the close, wheat and soyoil encountered losses which took the other markets off their highs.
As technicals took over Wednesday, the market was able to shrug off bean cancellations and a negative NOPA report for soyoil. The NOPA report was net positive for beans. Any weakness yesterday in the bean market was taken as a buying opportunity. In the actions -speaks- louder -than words, the ability to come back from negative trade speaks to technical strength, and interest in buying the market. Today we continue to see upside follow-through.
Other positives now being factored into the market is more chatter about yields coming in as less than expected, with some disease issues via the dry end to the season. Ideas are circulating that perhaps the USDA will have to dial down yields next month. As for business, the glut in the Gulf seemed to force China to purchase more expensive Brazilian beans, but their supplies may be getting low and they still need to cover their needs into the fall and winter.
As harvest proceeds there is also more talk that corn yields are less than expected, with the talk of a dry end to the season perhaps resulting in a drop of the final yield. Illinois fields seem to have triggered the most conversation in regards to disease and weak stalks.
WEATHER – Warm and mostly dry over the next 10 days across the US with limited rains in areas. Rains are ongoing in the south.
Global – there are still La Nina concerns and discussions concerning growing conditions in South America. Russia could use more rain.
REPORTS
Export sales:
beans: 21/22 net 1.26 tmt and 22/23 net 2,000 (vs. an expected 600-1.5 tmt)
meal: 20/21 net 95,400 tmt and 21/22 net 42,400 tmt (vs. an expected 75-400 tmt)
soyoil: 20/21 minus 1,700 and 21/22 net 6,100 (vs. an expected minus 20 to plus 20)
corn: 21/22 net 246,600 tmt and 22/23 net 2,300 tmt (vs. vs. an expected 500-1.0 tmt)
wheat: 21/22 net 617,100 tmt (vs. an expected 300-700 tmt)
Export sales were good for wheat and beans but low end for all else.
Wheat: good sales due to strong demand for feed and high quality wheat, with tighter supplies moving forward.
Corn: Sales were poor probably due to the Gulf. US is competitive, but so are Ukraine and SA.
Beans: Good sales with daily announcements from CHina, but the GUlf situation did impact exports. Brazil took the lion’s share of biz.
Soyoil: Sales remain low end. Rising world premiums makes soyoil expensive.
Meal: Sales were just moderate but better demand should be felt moving forward. The US is competitive.
ANNOUNCEMENTS
Russia’s Ag ministry data shows as of Sep 15, all grains harvested at 99.4 mln mt, which includes 70.8 mln mt of wheat and 17.5 mln mt of barley.
Argentina’s BA Exchange estimated production for 21/22 corn at 55.0 mmt vs. USDA at 53 mmt, and beans at 44 mmt vs USDA at 52 mmt.
Chinese buyers have agreed to relax a key quality specification for upcoming shipments of French wheat in response to rain damage in France’s harvest. Chinese importers will now accept readings of 75 kgs, (165 lb), per hectolitre, compared with 77 kg minimum initially required for import deals.
Calls are as follows:
beans: 2-4 higher
meal; 2.20-2.30 higher
soyoil: 50-60 lower
corn: 1/2-1 higher
wheat: 3-5 lower
Outside markets are firmer with crude oil trading up to $72.66/barrel. The US dollar trades higher to 92.79 with stocks down 35 pts.
Tech talk: November beans see positive price action, as the pullbacks have been very shallow showing that there is now buying interest in this market. Values are over $13.00, and the market now most likely moves into resistance from $13.05 / $13.10. The turn higher from lower is also over sideways congestion which was from $12.80 -$12.95, and now becomes a base of support. Trade over $13.06 finds very little resistance to stop a further advance towards $13.35, previous trading range tops, but we have to get there. December meal direction is sideways, and the market is trading from $335.00 up to $350.00. For the day expect that $340.00 is now a support level from which the market can rally from. The chart features a likely congestion trade from $340.00 to $350.00. December soyoil trading range works higher as well, and the chart direction higher suggests that this market is looking to test the 100 day moving average at 5980c, having defined 55c as an interim low. Pullbacks in this market are buying opportunities.
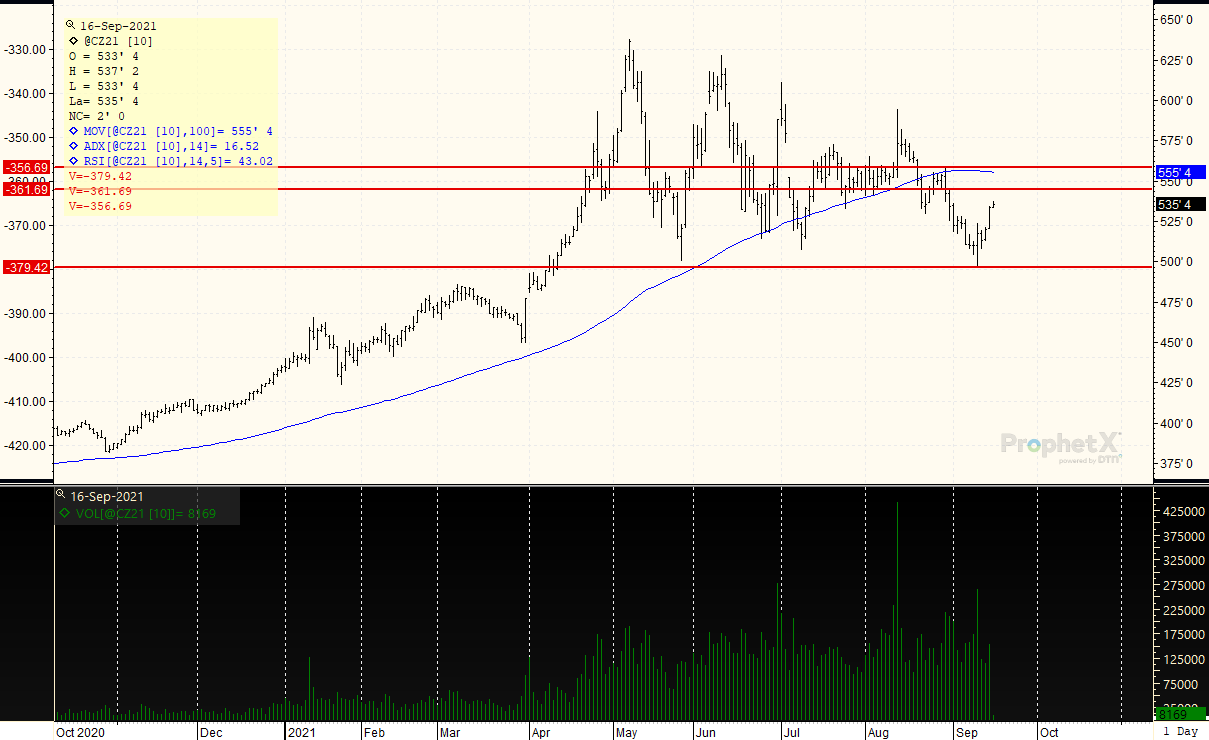
December corn prices turned higher from lower, taking out most resistance levels which were located at $5.25 to $5.28, sparking a rally towards $5.40. Interim resistance is $5.45, and with pullbacks shallow and the market well bid think we go there. Top of the trading range and very good resistance is $5.55. December wheat is also back over $7.10 after trading down to $6.77. Trading range is now from $6.80-$7.22/$7.55, but may move higher than this if buying takes us back over the key resistance zone which led to the break. For the day, wheat is struggling against $7.17-$7.20 resistance.
DECEMBER CORN: The reversal from the blow-off low last Friday was confirmed yesterday as the outside day closing higher now sees a rally above the highs of $5.30. The ADX is gaining a bit of strength, and open interest rose yesterday for the first time as prices traded upward signaling that new longs are probably in the market. The target high is now $5.45, which was the peak leading to the low under $5.00. The market is not yet overbot, and Wednesday’s price action goes a long way to confirming a bottom. Look for good support to move higher to $5.15, and $5.45 appears do-able. The market would move higher again if it traded over $5.45, with the 100 day moving average and peak high coinciding at $5.55, which is likely the top of this market for now should we go that high. We could be in the process of moving into a $5.20-$5.55 trading range.
Receive Relevant and Timely Grain Market Reports that Matter!
Get updated twice a week with concise, direct information that you can use in grain trading, marketing, and farm management
Better yet, become a customer and get DAILY updates, fundamental, and technical, sent straight to your Inbox! Contact Us now to get started.
RISK DISCLAIMER: Trading in commodity interest products such as futures, options and otc swaps entails significant risks of loss which must be understood prior to trading and may not be appropriate for all investors. You should carefully consider whether trading is suitable for you in light of your circumstances, knowledge, and financial resources. You may lose all or more of your initial investment. Opinions, market data, and recommendations are subject to change at any time. The placement of contingent orders by you or broker, or trading advisor, such as a stop-lossor stop-limitorder, will not necessarily limit your losses to the intended amounts, since market conditions may make it impossible to execute such orders. Long options strategies could lose their entire premium plus transactional costs. Short options strategies entail unlimited risk of loss plus transactional costs. The information presented represents the opinion of Ag Optimus. Past performance of actual trades or strategies cited herein is not necessarily indicative of future performance. Futures prices factor in the seasonal aspects of supply and demand. This communication may cite historic data and should not be taken to mean certain trades can produce dramatic profits year in and year out. This information does not imply customers have or will experience profits based on seasonal trades or trade data. All information, communications, publications, and reports, including this specific material, used and distributed by Optimus Futures, LLC (“Optimus”) shall be construed as, or is in the nature of, a solicitation for entering into a derivatives transaction. Optimus does not distribute research reports, employ research analysts, or maintain a research department as defined in CFTC Regulation 1.71. This email may include information produced by third parties. Material not labelled Optimus Futures should be considered to be third-party, and is provided for informational purposes only. Third-party material is from sources believed to be reliable, but its accuracy is not guaranteed by Optimus Futures. Optimus Ag and Ag Optimus are registered dbas of Optimus Futures LLC [NFA ID 0481133] CONFIDENTIALITY NOTICE: Privileged/Confidential information may be contained in this message. If you are not the intended recipient, please notify the sender immediately and you must not use the message for any purpose nor disclose it to anyone. Communications on all mediums may be recorded.