Commodities and equities saw a nice rebound to start the night. All posted gains at the start of the trading session, including soyoil. Gains in soyoil outpaced meal, as has been the case backing oilshare, while wheat prices traded higher as well maintaining recent gains for all three contracts. Prices continue to chop around in wide trading ranges, and have to wonder where the ag prices would have been yesterday were it not for a $5.50 drop in crude and a 900 pt drop in equities. The overhang into the Ag space impacted soyoil futures the most but crude and soyoil are higher.
Demand remains a focus and China’s pull on the markets may return this fall, particularly for corn given the failure of the crop in Brazil. Monday’s export inspections did not help the bean cause, though season -to-date exports are near 2,123 mln bu vs. 1,408 mln bu yr ago. Season- to -date corn exports are near 2,368 mln bu vs. 1,437 mln bu yr ago. Wheat inspections were higher than expected.
Grains will see higher prices as the weather calls for continuing dryness across the Dakotas and Minnesota which accounts for an estimated 20% of corn acres. As noted in crop progress numbers, Minnesota was the state featuring some of the largest declines for corn and beans.
STORIES
Argentina’s soyoil exports are forecast to rise, driving down prices internationally, due to a new law cutting the amount of soyoil -based biodiesel blended into common diesel fuel sold domestically, industry officials reported. Argentina’s law-makers approved a measure allowing a reduction in the amount of soy-based biodiesel to be mixed into domestically -consumed biodiesel.
WEATHER – Weather continues to feature a mostly dry and warm outlook which will add to crop stress on areas that missed out a week ago. Eastern Midwest areas will look to improve, needing a bit of warmer and sunnier weather. Forecasts for the next two weeks are concerning for the balance of July into August with below normal rains and above normal temps in the west, PNW, north and into Canada. Delta and estaern cornbelt areas remain good. Gist of the weather is supportive.
REPORTS
Crop progress
corn: 65% good/excellent, unchanged and vs. expectations of a small improvement. Dough: 8% vs. 7% average, Silking: 56% vs. 55% yr ago. Texas had the largest decline down 10% G/E. Illinois and Kansas improved 4-5% but Ohio and North Dakota ratings were down 4%.
beans: 60% good/excellent, improving 1% vs. 69% yr ago. Blooming: 63%, setting pods: 23%. Illinois and Kansas saw the best improvement, while Ohio and Minnesota ratings dropped.
spring wheat: 11% good/excellent vs. 16% wk ago, Headed: 92% vs. 92% average. The crop ratings at 11% good/excellent is the worst since the crop year in 1988 when the crop was rated 7% good/excellent in July
US winter wheat: 73% harvested vs. 73% yr ago and 74% average
ANNOUNCEMENTS
China’s bean imports from Brazil were lower in June vs. yr ago on poor crushing margins which weighed on demand, as reported by customs data. China purchased 10.48 mln tonnes of beans from Brazil, down from 10.51 mln tonnes prev. yr. The numbers are still 14% higher from 9.23 mln tonnes in May, as demand continues to be supported by the recovering pig herd. China imported 54,806 tonnes of beans from the US in June, down 80% from 267,553 tonnes yr ago.
Japan’s use of corn in animal feed fell to 47.8% in May vs. 49.3% yr ago, as reported by the Ministry of Agriculture.
Brazil’s AgRural reported that Brazil’s farmers harvested around 30% of the Safrinha crop in the center-south through July l5.
Calls are as follows:
beans: 18-22 higher
meal: 4.80-5.20 higher
soyoil: 70-80 pts higher
corn: 11-12 higher
wheat: 13-15 higher
Outside markets show a firmer crude oil market which trades up to $67.40/barrel, and a firmer US dollar at 93.09. Equities are 200 pts higher.
Tech talk: The break yesterday in Nov beans back to $13.70, (courtesy of weak macros), allowed us to see the trading range in this market, which does appear to be from $13.70- to $14.23. The comeback over $13.80 is impressive, and in the big picture the price action is sideways to higher with pullbacks of size holding with bounces. THink we probably approach $14.30 again in time given the positive construct of the chart, and if we take out $14.23 the next target is $14.50. December meal prices are congesting from $355.00 to $375.00, and continue to pivot around $365.00. In the process, more lines of support are also forming and if needing to price would do so along trendline support. A series of higher lows suggests the market could firm back up to reach its previous recent high of $375.00. December soyoil placed a new high at 6634c before breaking hard yesterday with its pullback to 6220c. Prices have recovered nicely today as we partially retrace the large break. Would still own pullbacks here as the major direction is higher, and the market had posted a new high for the move up before the hard break. Could be long against 6350c with the ability to target 65c quite easily.
The December corn chart finally shows some strength testing and keeping the $5.50 level intact with trade back to previous highs at $5.65 to $5.68. The ability to trade back towards the high yesterday and towards gap-fill at $5.73 1/2 is positive, and today therefore shows the best promise of follow-through strength to the upside. Look for a pullback in Dec. corn at $5.55 to find good support. December wheat continues to trade to new highs above $7.00 at $7.36 3/4. The market would not weaken with all the others yesterday, which was a foreshadowing of higher prices to come. Look for prices to continue to find strength and target $7.35 which is first technical resistance. Support for Dec. wheat moves up to $7.10.
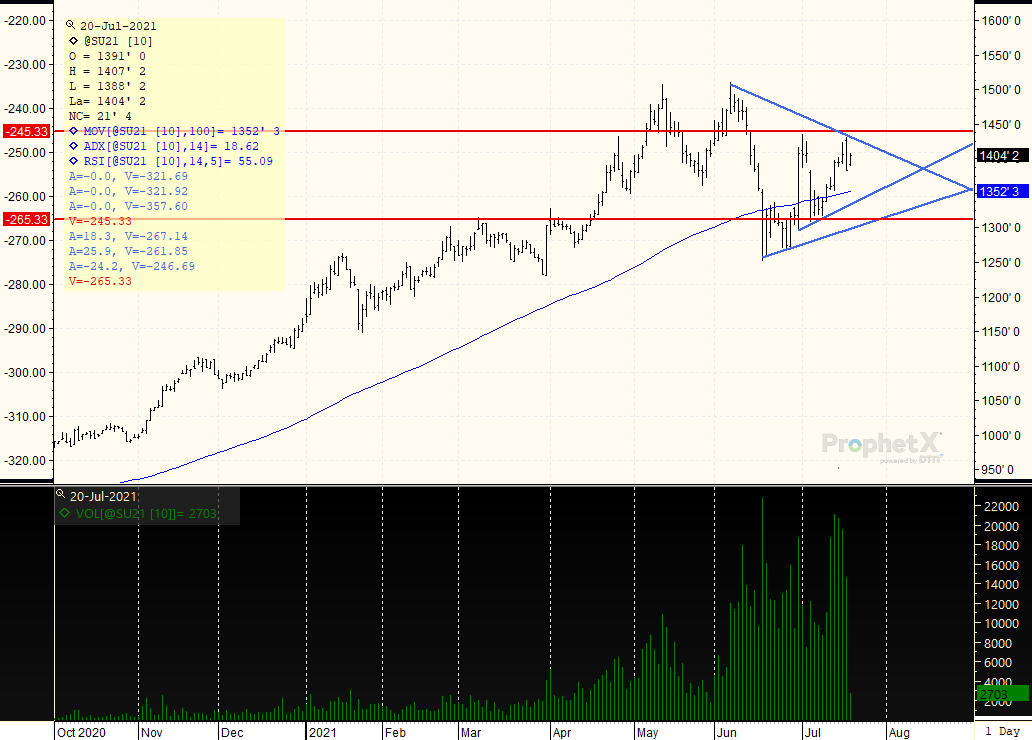
SEPTEMBER BEANS: The market may be in a trading range from $13.50 to $14.50, with peaks located at $14.30. However, in the big picture the pullbacks are repeatedly shallower which is allowing for the major trend to still remain sideways to higher. The 100 day moving average and trendline now cross at $13.50, offering strong support should we go there. However at this point think the weakness yesterday with the pullback to $13.81 probably marked a low, and the chart price direction could exit the triangle formed to the upside rather than downside. Look to continue to own breaks, as the chart is more positive than negative, though the ADX at 18 continues to point to a continuing struggle on rallies and breaks.
Receive Relevant and Timely Grain Market Reports that Matter!
Get updated twice a week with concise, direct information that you can use in grain trading, marketing, and farm management
Better yet, become a customer and get DAILY updates, fundamental, and technical, sent straight to your Inbox! Contact Us now to get started.
RISK DISCLAIMER: Trading in commodity interest products such as futures, options and otc swaps entails significant risks of loss which must be understood prior to trading and may not be appropriate for all investors. You should carefully consider whether trading is suitable for you in light of your circumstances, knowledge, and financial resources. You may lose all or more of your initial investment. Opinions, market data, and recommendations are subject to change at any time. The placement of contingent orders by you or broker, or trading advisor, such as a stop-lossor stop-limitorder, will not necessarily limit your losses to the intended amounts, since market conditions may make it impossible to execute such orders. Long options strategies could lose their entire premium plus transactional costs. Short options strategies entail unlimited risk of loss plus transactional costs. The information presented represents the opinion of Ag Optimus. Past performance of actual trades or strategies cited herein is not necessarily indicative of future performance. Futures prices factor in the seasonal aspects of supply and demand. This communication may cite historic data and should not be taken to mean certain trades can produce dramatic profits year in and year out. This information does not imply customers have or will experience profits based on seasonal trades or trade data. All information, communications, publications, and reports, including this specific material, used and distributed by Optimus Futures, LLC (“Optimus”) shall be construed as, or is in the nature of, a solicitation for entering into a derivatives transaction. Optimus does not distribute research reports, employ research analysts, or maintain a research department as defined in CFTC Regulation 1.71. This email may include information produced by third parties. Material not labelled Optimus Futures should be considered to be third-party, and is provided for informational purposes only. Third-party material is from sources believed to be reliable, but its accuracy is not guaranteed by Optimus Futures. Optimus Ag and Ag Optimus are registered dbas of Optimus Futures LLC [NFA ID 0481133] CONFIDENTIALITY NOTICE: Privileged/Confidential information may be contained in this message. If you are not the intended recipient, please notify the sender immediately and you must not use the message for any purpose nor disclose it to anyone. Communications on all mediums may be recorded.